
International Container Terminal
The investment case for the emerging market port operator


It's the turn of the millennium, the year 2000, and your closest investment friends have just sent an investment pitch for a listed company. The first sentence of the investment pitch reads, "It will operate in countries such as Iraq, Syria, Sudan, DR Congo and volatile emerging markets like Nigeria, the Philippines, Argentina and Pakistan.”
That sentence alone would be enough to dissuade most investors.
This wasn’t a hypothetical company. This was International Container Terminal Services (ICTSI), an EM ports operator and its backers, including the Razon family, made a bet that paid off well. Since the start of 2000 through May 27, 2025, ICTSI has delivered a staggering 11,302% return in Philippine Peso terms, or 8,191% (a 19.3% annual return) in US dollar terms, outperforming even tech giants like Adobe, Intuit, and Microsoft over the same period.
ICTSI’s journey has been anything but smooth. It exited Syria in 2012 as the civil war escalated, becoming too hostile. Its 20-year concession in Sudan, secured with an upfront payment of nearly $500 million, was unexpectedly cancelled, with the Sudanese government failing to pay them back in full. In Brunei, it relinquished operations following a government policy shift to favour state-owned operations. More recently, after winning the concession bid for South Africa's first port privatisation in Durban, rival bidders challenged ICTSI's win, and the South African government has since withdrawn from the port privatisation.
Yet through all this, ICTSI has remained remarkably resilient. It has posted positive EBIT, net income, and free cash flow every single year since 2000, paid dividends in all but two years, grown operating profits by 15.4% CAGR over the past 25 years, and has consistently delivered best-in-class margins and capital allocation, improving its EBIT margin from 25.6% to 53.5% in 2024, with a return on equity averaging 21.5% since 2000 and a market capitalisation of $15 billion today.
Despite its exceptional shareholder returns since its IPO, ICTSI’s growth story is far from over. It’s currently valued at 17x earnings and I expect its net profits to grow by at least 9% per year over the next five years. I will dissect its history, strategy and operations to explain why I believe we can double our investment in its shares. Here's what I'll cover in the deep dive:
The ICTSI history: Insights into its founder, chairman and CEO, Enrique Razon Jr and family, difficulties from the Asian Financial Crisis, culture and a timeline on ICTSI development through the years.
Philippines economy and utilities privatisation: I discuss the Philippines economy, its privatisation efforts in the 1980s, its currency, economic challenges and drivers of its growth.
The global ports industry: I analyse the listed and unlisted global ports industry and dive into the key players, regulatory and political changes shaping the industry and key factors driving the industry
ICTSI business model and Manila Ports unit economics in focus: I explore the revenue and cost drivers for ICTSI, its operations at ICTSI's core port in Manila, key features, competitiveness, and the unit economics of Manila's ports.
ICTSI Global concession growth strategy: Insights into ICTSI global growth strategy and case studies on success stories and reflections from its failed US bets and difficulties in Sudan and Brunei.
A Jenga IP Quality assessment: I analyse how ICTSI performs on our quality index and discuss strengths, such as barriers to disruption, profit margin, nature of demand, and the test of time.
Risks and challenges: I discuss several risks associated with ICTSI, including exposure to frontier and emerging markets, debt, concession revocations, political challenges, tariffs, trade wars, and impact from the Philippine economy.
Valuations: I develop a detailed valuation model of ICTSI, focusing on its earnings power, cash flow generation, and key assumptions for its growth drivers over the next five years.
1. International Container Terminals (ICTSI) history
Globally, very little is known about ICTSI's founder, chairman, and CEO, Enrique Razon Jr., but he's among the most skilled capital allocators I've come across, operating in emerging markets. Today, Razon oversees four listed firms in the Philippines. At the centre of his holdings is the crown jewel, ICTSI, which is four times bigger than his other three listed companies combined - Bloomberry Resorts, Apex Mining and Manila Water.
For decades before ICTSI's founding in 1987, Razon's father and grandfather both managed their family business (E, Razon, Inc. or Metro Port Services) focused on the marine cargo handling industry. In 1977, at age 17, Razon left Bowdoin College, frustrated by the lack of hands-on training. He returned to the family’s port business, where he started at the bottom. In a rare interview, he recalled this stage of life and mentioned he always wanted to work on a pier. His dad was disappointed with his academic decision, and he concluded that the best way to change his mind was by frustrating him at work, paying Enrique minimum wage, and forcing him to do tough jobs, such as operating cranes and driving forklifts. He persisted and rose through the ranks within the family business, eventually assuming leadership in 1994 following his father's passing.
Before transitioning to the CEO role, the Philippines underwent a sharp government transition in the mid-1980s led by its then-new president, Corazon Aquino, who sought to privatise various government-owned companies as part of her bid to shore up government finances. One of these assets was the Manila Port.
The Razon family created a new vehicle and partnered with the Soriano family of San Miguel Corp (who later sold most of their shares in 2006) and SeaLand Orient, a major shipping company (now under Maersk), to bid for the Manila port concession.
Their bid was successful, and they received a 25-year concession (1988-2013) from the Port Authority. In return, the new vehicle renamed Manila International Container Terminals (MICT), was obligated to pay the government $550 million over the concession period and invest $54 million in new cargo handling equipment.
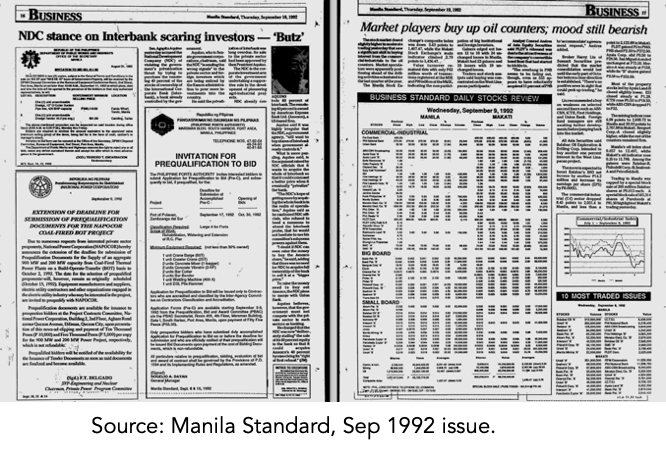
To grow its capital for future investments, ICTSI went public on March 23, 1992, at an offer price of PHP 6.70 per share. During my research, I came across news coverage in Manila Standard discussing its stock in its early days.
1994 marked a change for ICTSI. Enrique Razon Jr., then 34 years old, took control of ICTSI after his father's passing and drove a significant shift for the company. The early 1990s saw the privatisation of various emerging market ports, and Razon realised he was one of the few people who knew how to operate ports in emerging markets. He launched a global concession spree, and within three years, they acquired port concessions in Pakistan, Mexico, Argentina and Saudi Arabia.
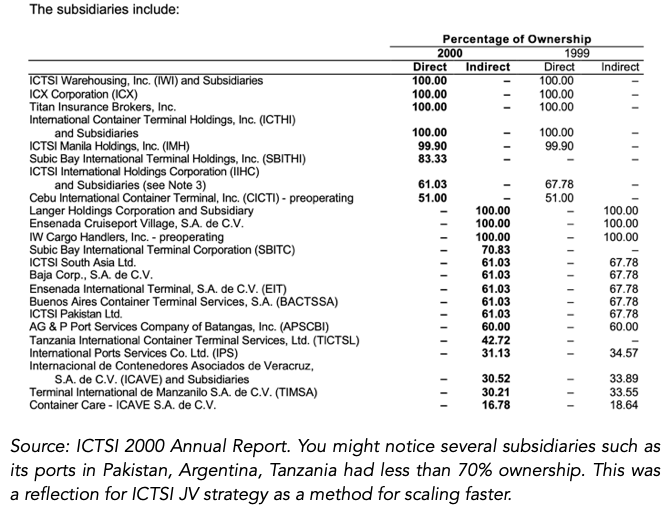
Razon wanted to scale quickly, but he also realised he didn't have the capital to be a sole operator. In most of these concessions, ICTSI operated in a joint venture and took on significant debt, a mistake he later regretted. For example, in Mexico, ICTSI managed the country's largest terminal in the port of Veracruz as a 50-50 joint venture with ICA, then Mexico's largest construction company. In Saudi Arabia, ICTSI partnered with Maritime Co for Navigation to operate the container and cargo terminal at King Abdulaziz Sea Port over a 10-year concession.
There was intense competition for these port concessions, led by CK Hutchison Holdings, P&O (originally from the UK but now owned by DP World), and SSA Marine. Razon was known to be in frequent motion, chasing contracts in Latin America, Eastern Europe and the Middle East and was often at the port's terminals around the clock, sleeping on his couch in the office. As his colleague put it in a 1997 Forbes article:
“He has enough frequent-flier miles to go to the moon….Ricky’s a tough person” - Forbes article, On the Waterfront.

Source: Enrique Razon Jr. Geo Panlilio for Forbes Asia
Between 1994 and 2000, ICTSI's revenue grew from PHP 1.3 billion to PHP 9.4 billion, a 34% compound annual growth rate (CAGR), and operating profits increased from PHP 429 million to PHP 3.4 billion, a 41% CAGR, without any significant share issuance. There was one problem though, the Asian Financial Crisis. Debt had swelled in the ASEAN region, and the countries had maintained fixed exchange rates, which encouraged external borrowing. ICTSI, like many others, were among the companies impacted by the crisis. Coupled with its swelling debt, which more than tripled during the period to a debt-to-equity ratio of 246% by 2000, it faced a significant financial problem and either had to sell assets or face the burden of bank loan repayments indefinitely.
This experience taught Razon and ICTSI a valuable lesson in managing risks, joint ventures, crisis management and preparedness and debt challenges. In 2001, he sold the company's international assets to its largest global competitor, CK Hutchison, for $400 million.
This wasn't the end of ICTSI's international strategy. It marked the turn to a new approach: full port ownership where possible, reduced debt, and a focus on longer-term concessions. Its first win in the new era was a 30-year concession for the Suape Port in northeastern Brazil, followed by the concession to operate the Gdynia terminal in Poland for 20 years (currently extended to 2053).
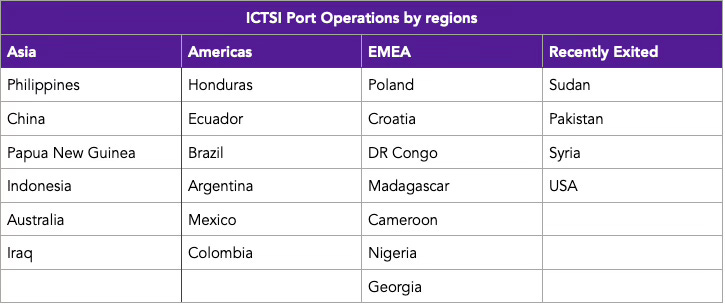
These wins in Poland and Brazil rebuilt ICTSI's confidence. They've since grown into a ports operator in 32 terminal operations in 19 countries: 10 in the Philippines, 4 in Brazil, 2 in Papua New Guinea, and one each in China, Indonesia, Ecuador, Poland, Georgia, Madagascar, Croatia, Honduras, Mexico, Argentina, DR Congo, Colombia, Australia, Cameroon and Nigeria.
ICTSI, in the mid-2000s, learned some important lessons on investing in ports. The more challenging an economic environment is, the more profitable the port can be for several reasons. First, you're less likely to compete with other ports internally, which supports existing volume growth and pricing per container. Second, these frontier markets are more reliant on imports to support domestic consumption, which similarly increases the profitability for ports as imports generate more revenue from shipping lines than exports. These insights led ICTSI to pursue higher-risk concessions in Iraq and DR Congo — both of which became high-return investments. Others, such as Syria, Sudan, and Brunei, proved to be challenging and loss-making. One unexpectedly bad investment was actually in a developed market, though: the port of Portland in Oregon, USA, where labour challenges and strikes forced them into terminating their 25-year concession early in 2017.
On the other hand, Iraq provides a compelling case study of the potential in these high-risk countries. In 2014, ICTSI won a 26-year concession to operate and expand Iraq's biggest and only deep-water port, Umm Qasr Port. ICTSI quickly improved its productivity, as quay crane productivity increased from 15 per hour to 53 per hour, while its annual capacity increased by an additional million TEU.
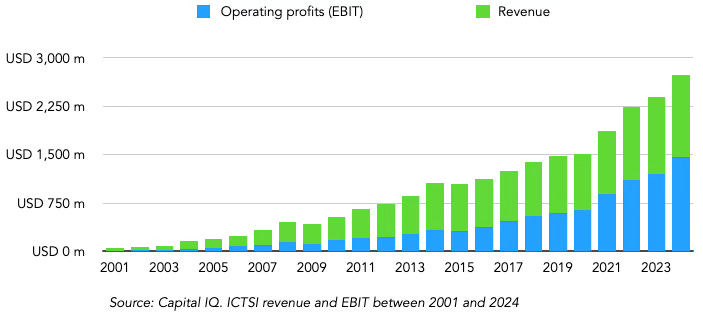
Since the start of ICTSI 2.0 in 2001, revenues have grown from $54 million to $2.7 billion, an 18.4% compound annual growth rate (CAGR). Interest expense/EBIT has declined by half, from 53% to 25%, and EBIT margins have doubled, from 26% to 52%, over the 23-year period.
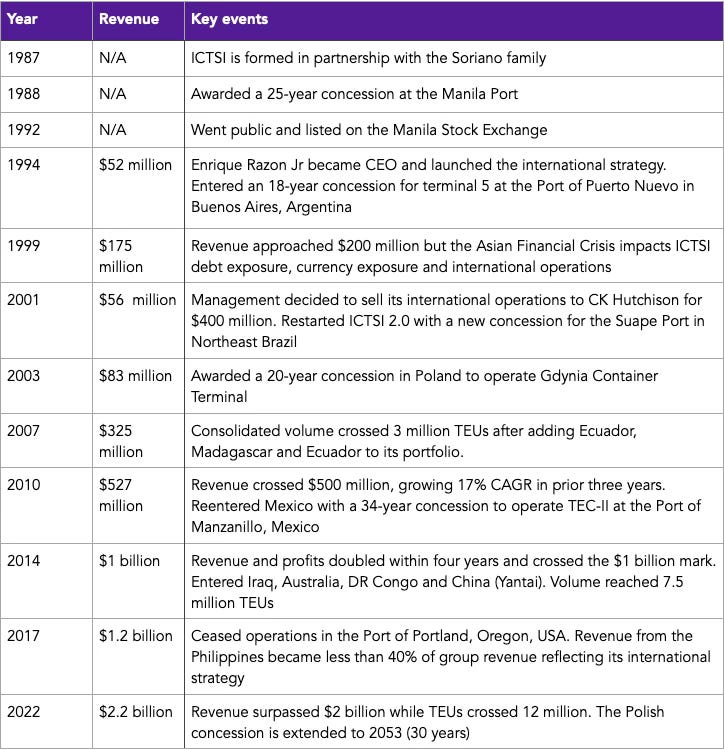
In the table above, I present a snapshot of ICTSI's history over the years, including its revenue and a brief description of key milestones. As shown, ICTSI has achieved steady growth since 2001, with ICTSI 2.0 employing multiple approaches for growth, including price increases per TEU, additional volume capacity (see below), and acquiring new concessions. 2014 was a significant year for ICTSI, as it won a record four new concessions in Iraq, Australia, the Democratic Republic of the Congo, and Yantai, China. These ports significantly increased ICTSI's volume capacity and revenue, as volumes grew 17.9% in 2014, while revenue grew by 24.5%, its highest annual growth in the last decade. Over the 23-year period, revenues increased at an 18.4% CAGR, while profits grew at a 22.3% CAGR, growing 102-fold in USD terms.
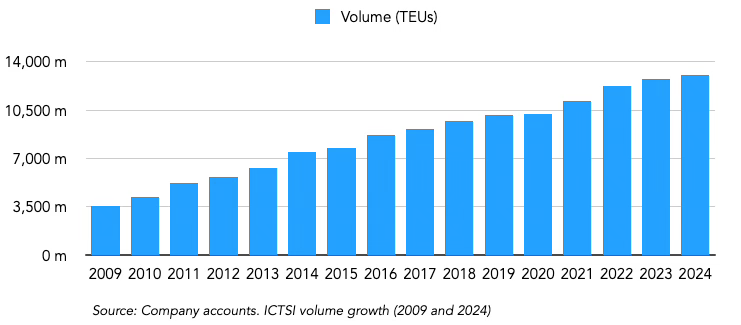
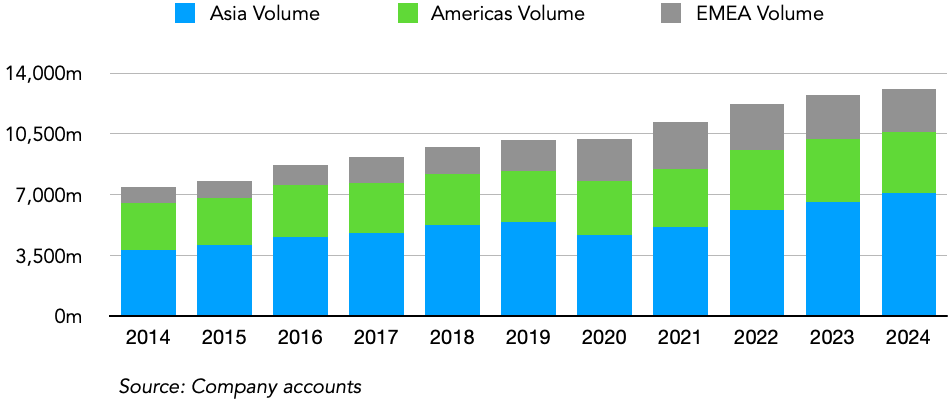
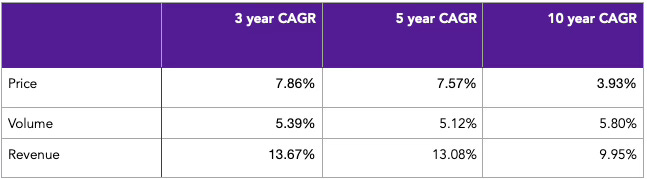
As I will discuss in the business economics section later in this article, volumes are a crucial aspect of port operations, and the industry primarily focuses on TEU (Twenty-Foot Equivalent Units). Here, ICTSI has similarly grown volumes by an impressive 9% CAGR over the past 15 years, while pricing has increased by roughly 4.2% per year.
Before understanding ICTSI's Manila anchor, it is essential to understand the broader Philippine economy and how its privatisation wave has created one of Asia's most overlooked infrastructure champions.
2. The Philippines Economy
Ports reflect the real economy. As gateways for most traded goods, macroeconomic conditions directly shape ICTSI’s investment profile. As a member of the Southeast Asian Tiger Cub economies, the Philippines has experienced fast growth in recent years, averaging a 5.6% 10-year GDP growth rate, the fastest among the major Southeast Asian countries. Yet on per capita income and development metrics, the Philippines lags behind its Southeast Asian peers. Here are the key indicators for context.
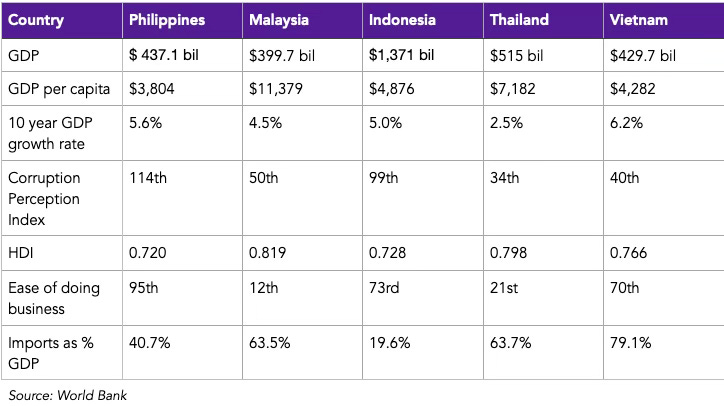
As shown, the Philippines is the worst-performing in terms of GDP per capita, corruption perception, ease of doing business, and Human Development Index (HDI).
Key Philippines Stats
GDP per capita: $3,804
GDP: $437 billion
10-year GDP growth rate: 5.6%
Population: 114.9 million
Unemployment rate: 3.9%
Inflation rate: 1.4%
Corruption Perception Index: 114th
Credit rating: BBB+ S&P Global
Ease of doing business: 95th
Main Import partners: China (26%), Indonesia (8.6%) and Japan (8.2%)
This perspective is critical for understanding the environment in which ICTSI has operated for decades. An interesting metric is the Philippines' import dependency. The Philippines, like the rest of Southeast Asia, excluding Indonesia, is quite reliant on importation; in 2024, imports represented 40.7% of its GDP, well above the world average at 28% and 74% higher than its export value.

Electrical and electronic equipment plays a significant role in the Philippines' trading activity, accounting for half of the country's exports. Major companies involved here include STMicroelectronics, Texas Instruments and Integrated Micro-Electronics (IMI), a subsidiary of Ayala Corporation, one of the major domestic conglomerates. These companies rely heavily on parts and sales to the semiconductor industries in South Korea, Japan, and China and consider the Manila port a key part of their value chain, given their reliance on containerised ships. For example, it's estimated that Texas Instruments alone is $3 billion of all electronics exports in 2024.
Unlike electronics, mineral fuels and oils, and cereals, utilise alternative ports such as Bataan, where the Bataan Refinery is located, or the Subic and Iloilo ports (also operated by ICTSI), which are closer to agricultural demand, given that these cater for bulk cargo port products.
Philippines privatisation
Since the transition from Ferdinand Marcos (father of the Philippine's current president, Bongbong Marcos) to Corazon Aquino in 1986, the Philippines has privatised several previous state-owned assets, with the Manila ports being a primary example. The key reason was to reduce the fiscal burden on the government, but other factors, such as service quality and economic liberalisation, further pushed the Philippines towards privatisation. To date, the power, telecommunications, water, and transportation sectors have led the economy in privatisation.
What is important here is understanding the track record of privatisation efforts and the regulatory and government risks. From my research, most failures, such as those of Maynilad Water Services and Philippine Airlines, have been mainly due to management by the privatised groups, which suggests a lower actual risk of state capture post-privatisation. ICTSI is also one of the successful companies that have renewed concessions in the past, alongside Manila Water, which is also owned by ICTSI's CEO, Enrique Razon Jr - Manila Water company successfully extended its concession to 2037.
The Philippine peso
In emerging markets, a primary concern of mine is currency volatility and the economic pressures that could lead to a long-term depreciation trend against the US dollar. One of the reasons I like ICTSI is that part of its port operations are naturally hedged, given the shipping industry’s preference for operating in US dollar terms. That said, it's still essential to review the Philippines' currency landscape. Since the end of the Asian financial crisis, a period during which it lost half of its value, it has performed better than most emerging market peers depreciating by just 28%, roughly 1% annually. There are fundamental reasons for this.
Export diversity: The Philippines' economy is quite diverse in terms of export products and its broader economic activity. Unlike countries like Angola and Iraq, the Philippines isn't reliant on exporting a single commodity and has non-commodity exports, such as electronics, machinery, optical and medical apparatus, representing nearly two-thirds of its total exports. This export diversity helps increase its resilience to external shocks and allows government finances to be redirected into other areas of need.
FDI and remittances: Overseas Filipino Workers (OFWs) send home nearly $35 billion annually in remittances, the third-highest in the world after India and Mexico, accounting for around 9% of the country's GDP. This brings a steady source of foreign exchange for the Philippine economy, supporting FX reserves and easing monetary strains. The BBC presents a documentary covering this remittance trend.
Manageable debt levels: Debt and interest payments often lead to chronic financial challenges for emerging economies, especially in situations where interest rates rise, as has been the case over the past five years. The Philippines is currently ranked 85th among all countries, with a debt-to-GDP ratio of 56.9%, which I view as average. What gives me greater comfort is the nature of its debt, mainly domestic. Foreign government debt is less than half of domestic debt, while its overall external debt is 27%, among the lowest in the world.
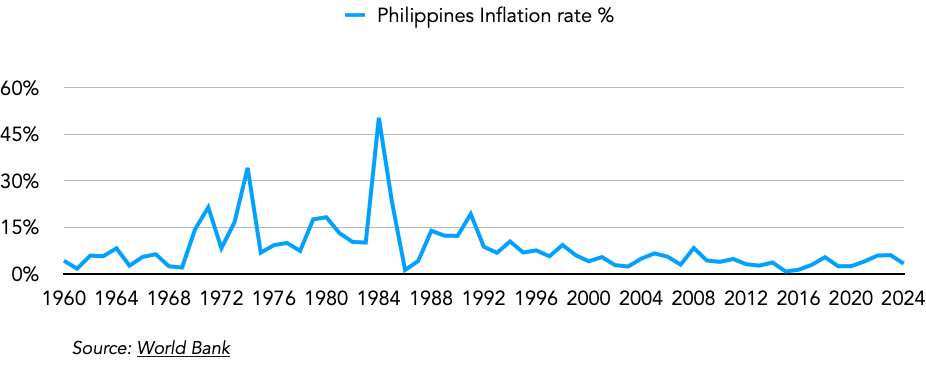
The chart above presents the Philippines' inflation rate since 1960. Since 1992, its annual inflation rate has been below 10% and much less volatile than that of many other emerging economies.
While the Philippines trails its regional peers in some areas, it remains a fundamentally investable market, particularly when adjusted for risk. Two ways to account for its risks are by adding a margin of safety to its fair earnings multiple (13x) and also expecting some depreciation when calculating earnings in US dollar terms. Internally, I've estimated a 3% depreciation per year relative to the US dollar. While this is much higher than the 1% depreciation it achieved in the 21st century, the 2% difference provides an additional margin of safety.
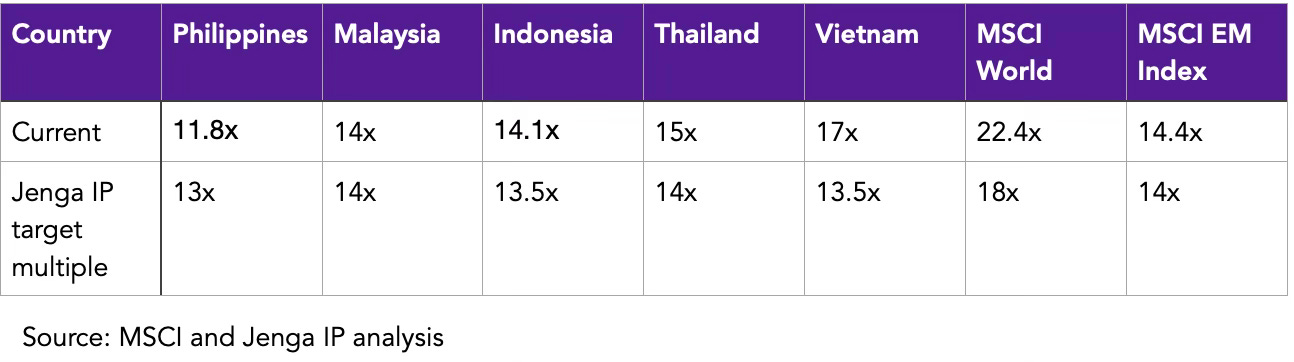
Bringing my economic insights together, the table above positions the fair multiple for the Philippines and its comparable economies relative to the MSCI World Index and the MSCI Emerging Markets Index. My average multiple for the Philippines is 13x (currently valued at 11.8x), and I will only pay above 13x earnings for a higher-than-average quality business (high barriers to entry, 9% ROIC, >65/100 on Jenga IP Quality index) and one with faster than average earnings growth (GDP +4%).
Ports often meet the quality threshold; durable, defensible, and high-margin. But few can consistently reinvest at high returns. ICTSI stands out not just for its resilience, but for how it allocates capital across a global footprint. To understand why it deserves a valuation premium, we need to examine the global ports industry itself, its economics, players, and capital intensity.
3. The Global Ports Industry
Transportation infrastructure (airports, ports, toll gates, and railways) is generally a high-moat industry with substantial barriers to entry. In the Jenga IP Industry Quality Index, discussed in my last article, "Investment Process," the industrial transportation, ground, and infrastructure industry ranked 4th out of 60 industries, scoring highly on replacement cycles and barriers to disruption. Though growth is modest, incumbents benefit from long asset life cycles and limited competition, which is central to my thesis on ICTSI.
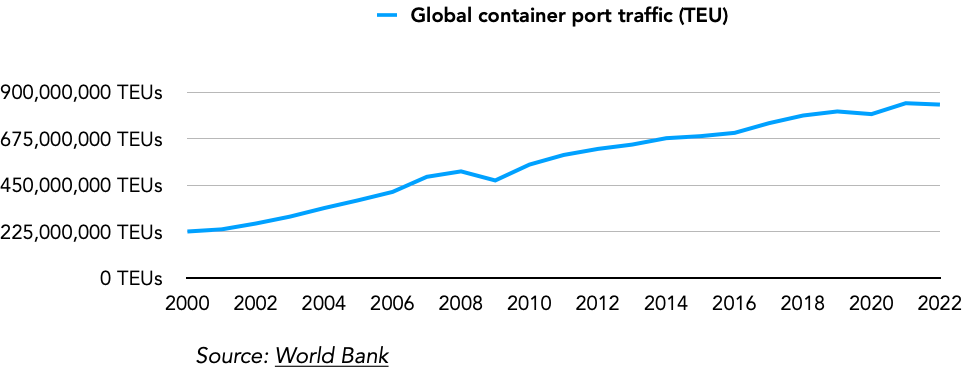
Since the advent of containerisation in the 1950s, global trade and container port traffic have experienced an upward trend, growing at a rate faster than the global economy. The chart below presents global port traffic in TEUs since the beginning of the 21st century. It has compounded at a rate of 6% since 2000, primarily driven by the effects of China's membership in the WTO in 2001.
Trade as a % of global GDP has nearly doubled since 1970, a structural tailwind that terminal operators have monetised consistently.. The penetration is notably higher among higher-income countries compared to lower-income countries, at 63% versus 50%. Lately, however, there has been a decline in the pace of trade growth, driven by several factors, including onshoring efforts among developed economies, China's economic slowdown, and increased protectionist measures by various countries.
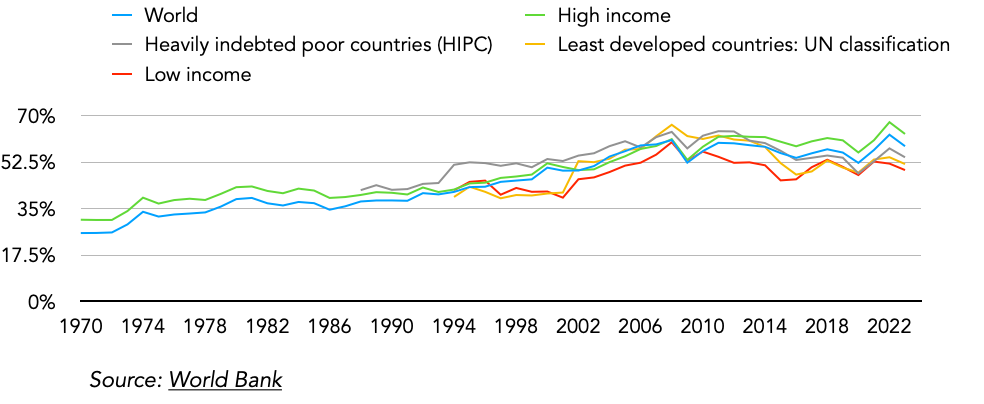
At 63%, developed economies are nearing trade saturation. Further gains in trade-to-GDP share face diminishing returns and logistical limits. However, for lower-income countries, there is still room for increased trade volume as GDP per capita grows, leading to increased consumption demand and improved industry and manufacturing capabilities.
To further explore the trade volume split between higher and lower-income countries, the table below examines ten regions: six emerging markets (highlighted in red) and four developed markets.
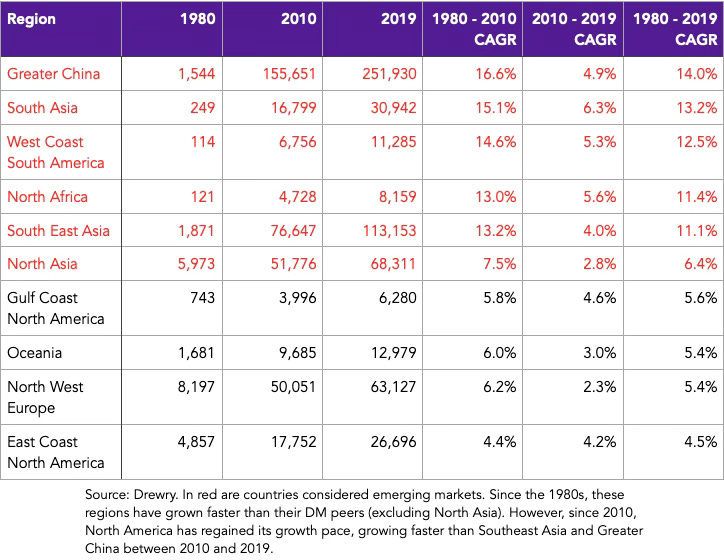
As shown, over the 39 years, the growth rates among emerging market regions were significantly faster compared to those in developed markets, e.g., South Asia's 13.2% versus North West Europe's 5.4% CAGR between 1980 and 2019. Even more recently, while growth rates have certainly slowed over time, they remain well ahead in emerging markets compared to developed markets.
This divergence in trade growth is central to my preference for emerging-market port operators like ICTSI. Of course, higher growth isn't prevalent in all regions, such as North Asia, which grew by 2.8%, slower than the 4.2% growth rate at the East Coast North America region.
In global trade, ports and shipping lines form the two dominant nodes. But from an investor’s perspective, ports are structurally superior: pricing is steadier, Capex is longer-dated, and returns are less cyclical. In some cases, the port operators and the shipping company may be the same company, as seen with COSCO Shipping. However, there is an increasing trend for independent port operators, like ICTSI, to be appointed by port authorities.
In the table below, I outline the eight largest port operators by market share, presenting their 2018 and 2023 TEU volumes, as well as their growth rates for the five years. Roughly 60% of all global ports are operated by these private sector operators, with the remaining 40% managed by the public sector.
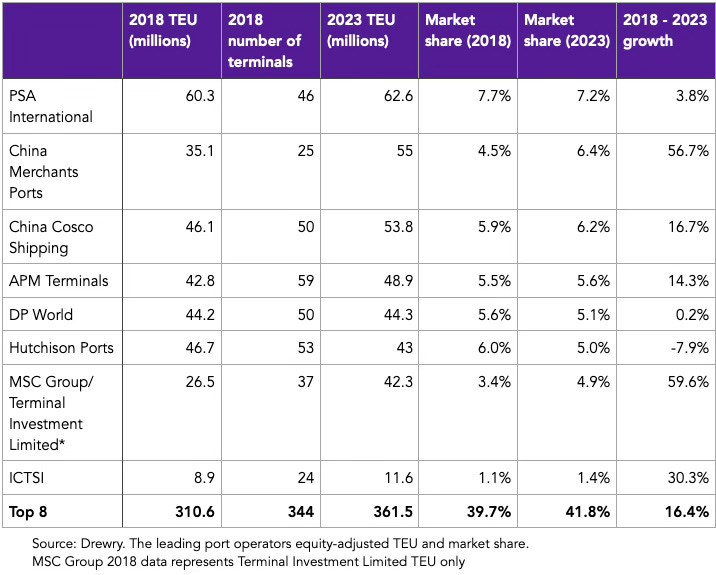
Three dynamics in the port operator landscape have direct implications for ICTSI’s future: scale of the largest, consolidation, and competition creep.
The Big 7 companies: While ICTSI is the national market leader, the ports industry is more global, and here, ICTSI has a market share of just 1.1%. The top seven companies, led by Singapore's PSA International, dominate the global port industry, holding around a 40% market share. On the one hand, it indicates that there is still a significant scope for growth in ICTSI; if it were to triple its market share, ICTSI would still have a smaller share than the 7th largest player.
However, it also emphasises how difficult it has become to win new concessions, as ICTSI will likely have to compete with the big seven companies in RFQs. This was evident in the recent case of the South African Durban Port, where ICTSI had to contend with APM Terminals, DP World, and Cosco Shipping Ports. More detrimental would be if these companies present more competitive proposals for ICTSI's current concessions when they end, leading to lower margins if ICTSI were to extend their concessions.
Increased consolidation: Although marginal, the top 8 companies increased their market share in the global ports industry by 2.1% over the five years, reflecting the ongoing consolidation led by the Chinese port operators (China Merchants Ports and China Cosco Shipping) and MSC Group. These companies pose a threat to smaller players like ICTSI, given their resources. There is also increased interest from these larger companies in frontier markets compared to previous years, which could be an additional challenge for ICTSI in the future. On a more positive note, despite the competition, ICTSI was among the fastest-growing companies in terms of volume, growing at a rate of around 5% per year despite the ongoing consolidation.
Another trend in consolidation is the increasing vertical integration of shipping lines that own ports. Some of the fastest-growing major port operators, including MSC Group and China COSCO Shipping, CMA CGM, and Evergreen, are also key players in the shipping industry, holding nearly 16 million TEUs in annual shipping capacity. MSC Group, in particular, is quite active here, and if the recent Hutchison Ports acquisition goes through, MSC Group will become the largest Port operator, surpassing PSA's 7.2% market share in 2023.
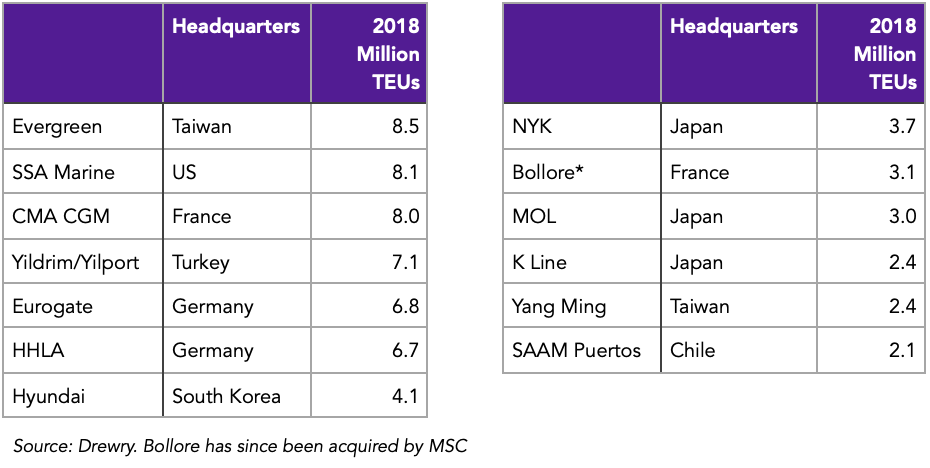
Beyond the big seven: In the table below, I list the remaining twelve companies which complete the top 20 port operators from the most recent complete dataset I could find. Here, there is a diversified range of companies, from Japanese players such as MOL and K Line to Turkey's Yilport, further reflecting just how diverse the industry is.
These smaller companies are increasingly becoming more global and expanding into territories ICTSI focus on. For example, CMA CGM currently manages the Nigerian Lekki Port, a port ICTSI had previously withdrawn from. There's also increased collaboration among these players as a bid to compete globally. For example, Yildrim Holdings owns a 24% stake in CMA CGM and has extended its relationship, which was initially intended to last only five years.
4. ICTSI Economics and value drivers
ICTSI's core value driver is its ability to operate high throughput, high margin, long duration concessions in underserved ports. This model delivers consistent revenue growth per TEU and margin expansion as volumes increase and next, I will breakdown its economics and business model.
Region
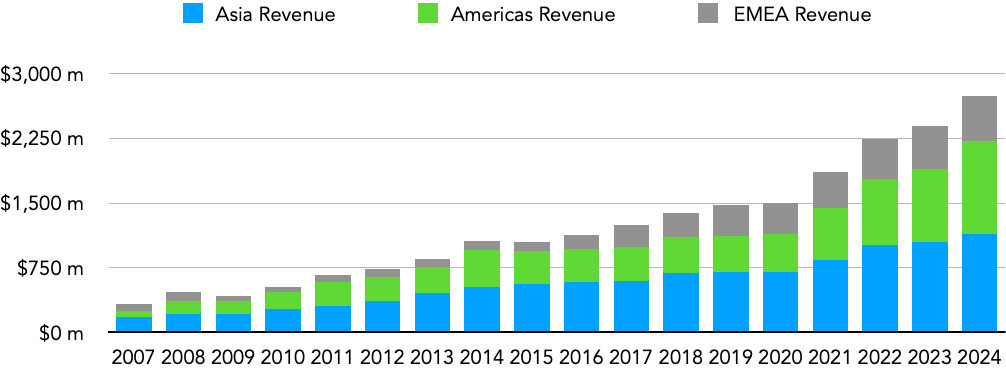
ICTSI divides its operational regions into three areas: Asia, the Americas, and the EMEA region. Although it no longer provides revenue or volume data for each country or port managed, I’ve developed some estimates based on internal and alternative data, including port yields and volume data, during my research. In the chart below, I break down ICTSI’s revenue from its three regions for the past 17 years.
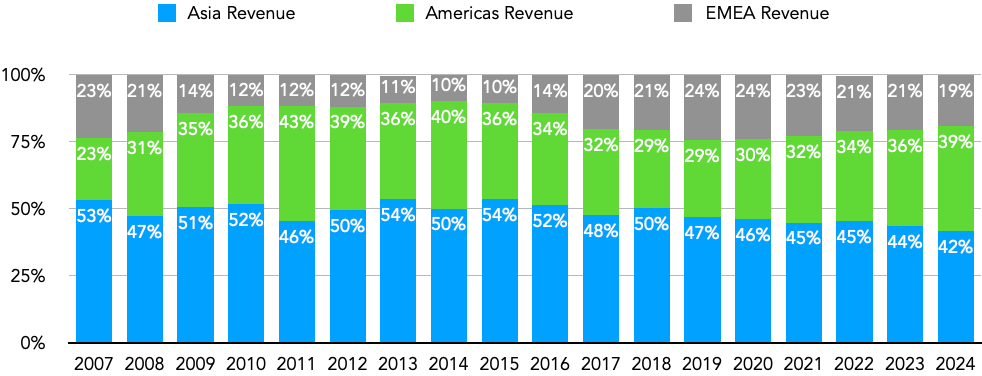
ICTSI’s revenue is spread across Asia (42%), the Americas (39%), and EMEA (19%) — a shift from 2007 when Asia alone contributed over half. The Americas have shown the strongest growth, particularly Mexico and Brazil, driven by nearshoring dynamics and ICTSI’s deepening local ties, including the appointment of regional veteran Anders Kjeldsen. EMEA, historically the smallest contributor, remains the most volatile due to political risk in Sudan, Nigeria, and Syria. However, ICTSI has found success in frontier markets where it holds a near-monopoly market share, such as Madagascar and the Democratic Republic of the Congo, and is now exploring Djibouti following high-level talks with the port authority.
Growth potential is strongest in the Americas, driven by a rising appetite for privatisation and ICTSI's strong regional relationships. However, competition is intensifying. CGA CGM, for instance, recently acquired a 50% stake in Santos Brasil, the the operator of South America's largest container terminal.
Port type
ICTSI primarily focuses on mid-to-large gateway ports, which are more profitable than transhipment ports, but constrained concession availability has forced some trade-offs, including accepting smaller ports in certain regions.
In the table below, I highlight ten key ports under ICTSI's management, including their concession length and key port facilities and equipment, such as forklifts, prime movers, chassis, quay cranes, rubber-tired gantries, and their size in terms of capacity and hectares.
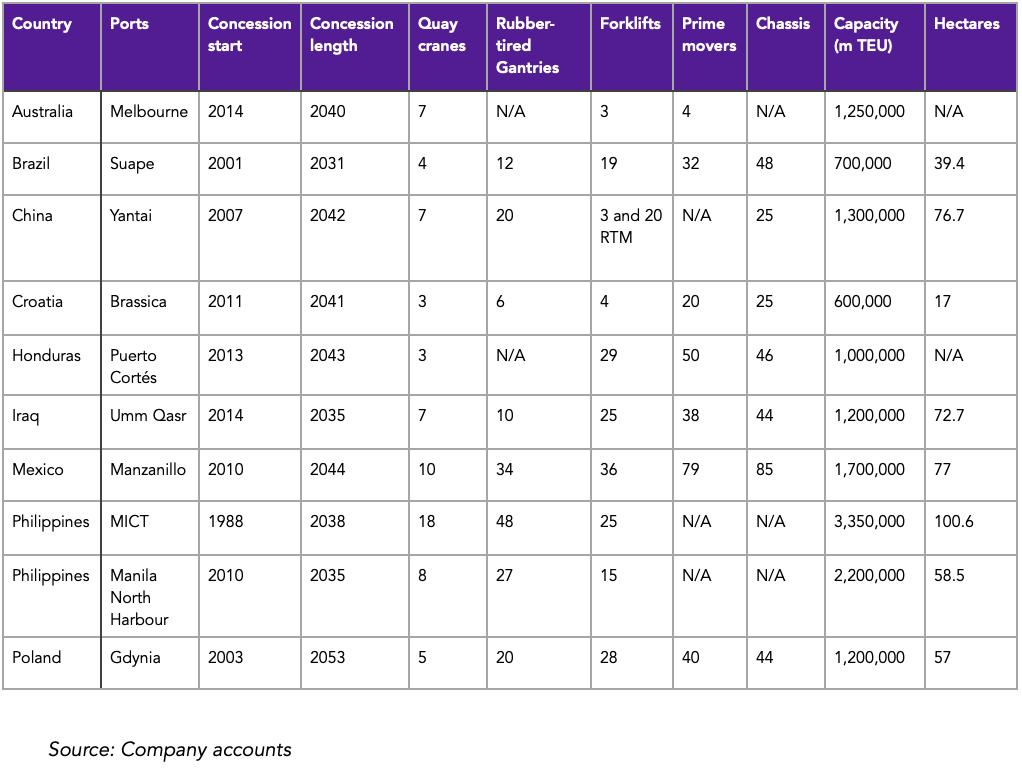
On average, ICTSI's top 10 ports have 15 years of concession life remaining, which is enough to secure multi-cycle cash flow visibility. ICTSI has also successfully renewed significant concessions for ports such as Manila in the Philippines, Poland's Gdynia port, and, most recently, its port in Madagascar (not included in the table above). That said, it has also lost some key concessions, with the Pakistan port of Karachi being a recent concession loss to its rival AD Ports.
From a size and facilities lens, these tend to mirror demand and catchment area. The bigger the regional market, the greater the demand for port services from consumers and businesses, and the larger and more investments required to manage the port. ICTSI's biggest port by TEU is its flagship Manila port, which currently has a capacity of 3.35 million TEUs and is expected to grow to 3.5 million TEUs in the near term.
A key part of the growth equation is understanding ICTSI's ability to enhance the efficiency and overall capacity of each port. For the latter, it's to a large extent, out of ICTSI's control, as it depends on regional demand and port authority targets. However, for the former, ICTSI has a moderate to high level of control over its efficiency. ICTSI no longer reports this data in its accounts; however, based on its last reported figures in 2019, Asia and the Americas performed significantly better than EMEA in utilisation, averaging nearly 60% throughput/capacity in both markets but around 50% in EMEA.
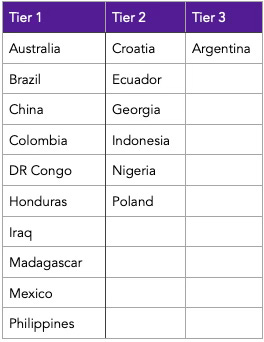
Before concluding, we first need to consider ICTSI's regional market share and port tier based on how mission-critical they are to their markets (tier 1 to tier 3). In the following table, I present 17 major ports across the ICTSI portfolio, including their regions (national or state), their market share within these markets, their competitors, and their market share where data is available.
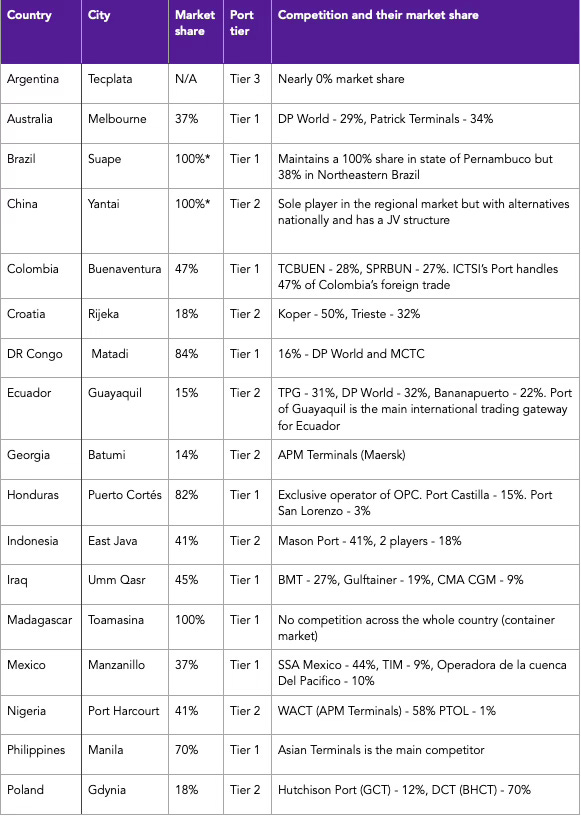
Alongside concession length, two other key factors that determine the economic moats for operators are regional market share and port tier ranking. ICTSI performs quite well in both areas. Ten of the 17 ports are considered tier 1 ports - mission-critical, limited substitutes and favourable market share. Among these tier 1 ports, its Madagascan port in Toamasina has a 100% market share with no other competitors. In other Tier 1 ports, ICTSI competes with a wide range of players, from DP World in the Democratic Republic of the Congo to national players like SSA Mexico in the Port of Manzanillo.
Tier 2 ports mainly consist of ports where ICTSI either lacks market leadership or competes with nearby or alternative ports. In Poland, one of ICTSI's earliest ports, they compete with adjacent ports managed by Hutchison Ports (with a 12% market share) and Deepwater Container Terminal (with a 70% market share). These ports tend to be less profitable, as shipping lines often have alternative ports, leaving ICTSI with less pricing power —a key attribute in the investment equation.
Argentina is relatively insignificant for ICTSI, as the ports in Buenos Aires have rolling concession extensions with open capacity, making them a tier 3 port.
Next, I will explore the financial profile of ICTSI split by:
Revenue
Costs
Capital expenditure
Unit economics
Revenue
The starting question, as always, is how does this business model make revenue?
Ports revenue model can be split into four key areas:
Vessel charges on-vessel or stevedoring (40-45% of revenue)
Yard charges off-vessel or arrastre (25-30% of revenue)
Storage (10% of revenue)
Others (15-20% of revenue)
ICTSI doesn't split its revenue into these segments, so my calculations here are estimates based on alternative research data.
Vessel charges (on-vessel), which refer to the loading and unloading of cargoes on and off ships, are typically 40-45% of a port's revenue. Several factors impact the pricing of vessel charges. Palletised freight is generally easier to load and unload and is cheaper than non-palletised freight. The weight of the cargo also impacts the vessel charge. In Manila, 5-10 ton heavy lifts cost $11.00 per metric ton, while freight above 30 tons costs $21.27 per metric ton. Furthermore, materials such as steel products, like wire rods, cost a fifth of the log cost, $2.07 versus $9.20 per metric ton.
Yard charges (off-vessel) are billed per TEU or metric ton and represent the costs associated with loading and unloading cargo from trucks to receive import cargo or deliver export cargo. I estimate that these yard charges are between 25% and 30% of ICTSI's total revenue. Several factors impact the yard charges. Like vessel charges, the size, material type and packaging affect the yard charges.
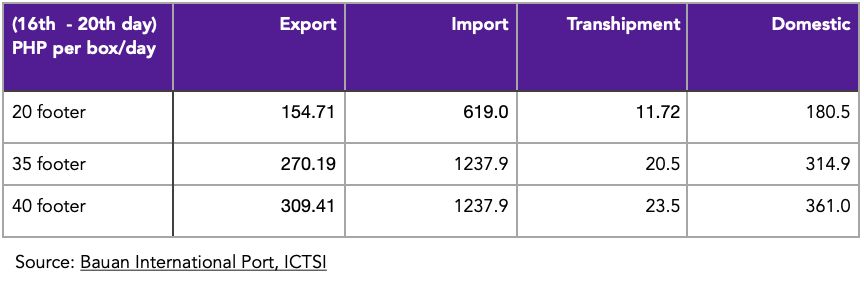
Storage charges are significantly smaller than both vessel and yard charges and are billed periodically, depending on the size of the container and cargo. In ICTSI's most recent storage charge tariffs at its Bauan port, the cost of imported products is nearly four times that of export products, while transhipment products account for just 2% of the cost of imported cargo prices.

Finally, others represent additional services typically requested by shipping lines, including anchorage-related fees, weighting of trucks, provision of refrigerated containers and wharfage and harbour fees. I estimate this to be around 15-20% of ICTSI's total revenue. The chart below brings the four revenue lines together based on my estimates.
Price and volume by region
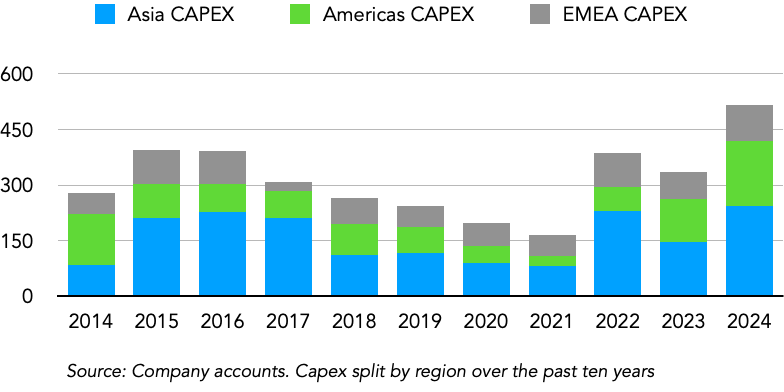
Another way I assess revenue is through a price and volume lens. Here, ICTSI publishes its volume, which gives us some scope to calculate its pricing. In the chart below, I present ICTSI's volume by region over the past 10 years.
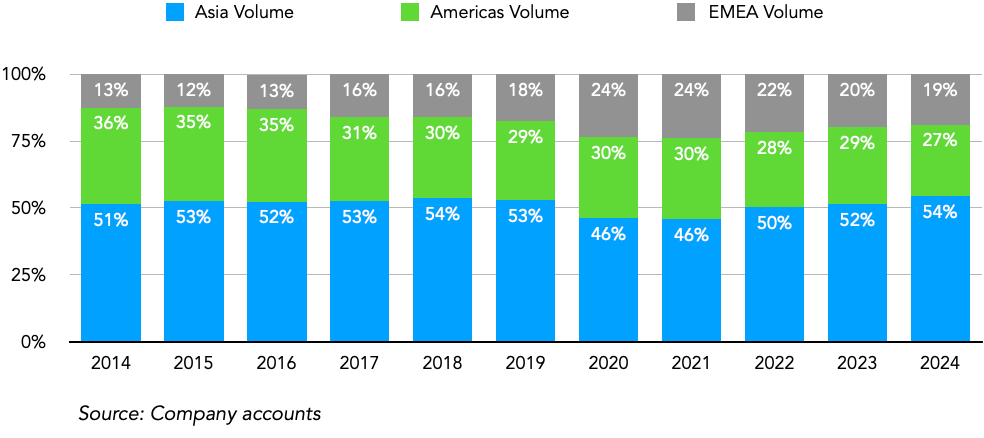
Over the past decade, Asia has consistently accounted for more than half of ICTSI's volume, even as its revenue contribution declined, reflecting its lower pricing power compared to the Americas. EMEA, on the other hand, maintains a 19% share in both volume and revenue.
Overall, Asia, the Americas, and the EMEA have grown at a 6.4%, 2.67%, and 10.2% CAGR, respectively, over the past ten years, and at a 5.8% CAGR across ICTSI.
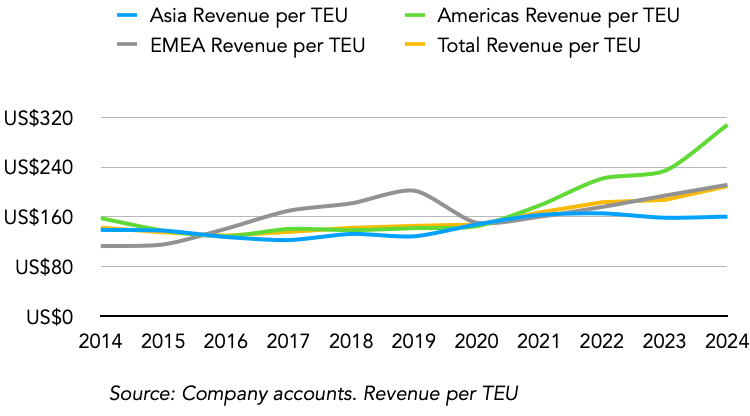
This brings us to pricing, and in the table below, I share the revenue per TEU for each region over the past ten years. Note that the revenue data includes non-containerised and passenger figures, which means the actual revenue per TEU is smaller than my calculations below. Overall, there has been a long-term trend of growth, with prices increasing by 3.93% per year across all regions. However, this growth has accelerated in recent years; the America's pricing increased by 26% in 2024 alone. I attribute this price increase to tariff adjustments in Port of Manzanillo, Mexico, but such spikes are unlikely to persist.
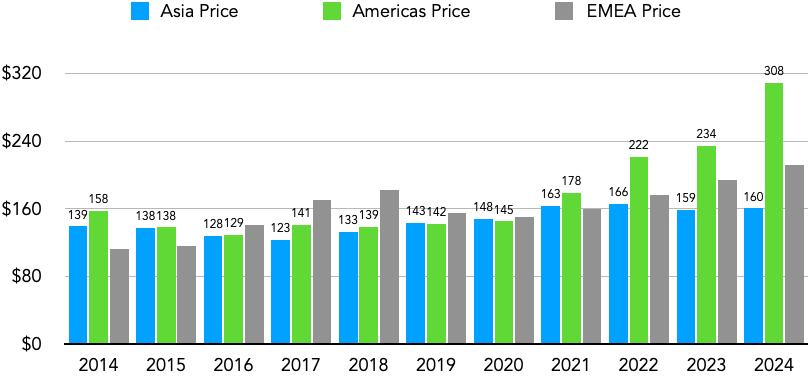
Overall, I don't see the price increases experienced over the past three years as sustainable. I model these price increases to be between 3-4% between 2024 and 2029, while volume is expected to remain at 5%, with GDP growth of 2-3% across its geographies.
Costs
While high margin, ports have significant recurring costs involved in delivering services to customers, the shipping companies. Here, I split ICTSI's costs into three segments:
Operational costs
Depreciation and Capex
Financial costs and unusual items (interest expenses, taxes, impairments and asset writedowns)
Note: The PFRS 16 leases accounting change, which reclassifies payments from annual expenses to right-of-use assets and lease liability, means that comparing expense lines before 2019 isn't like-for-like. As a result, I use five-year comparisons for costs rather than ten years as with revenue.
Operational costs
ICTSI’s operational costs are further split into four areas;
Manpower costs (38% of costs): Salaries and bonuses to employees in operations, engineering and finance. Staff in operations is roughly 70% of all total employees, with just over half of them in Asia. 53% of all staff are unionised.
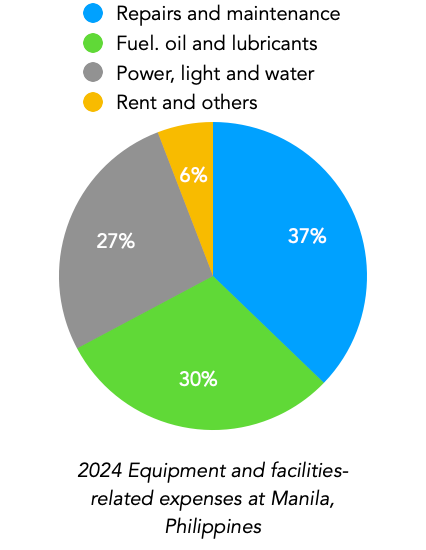
Equipment and facilities-related expenses (20% of costs) include expenses dedicated to general repairs and maintenance at port facilities, as well as utilities and technology costs.
Port authorities’ share in gross revenue (24% of costs): These include the variable fees paid to port authorities as agreed in concession agreements.
In the charts below, I compare ICTSI’s 2019 and 2024 operating cost structure, and you will notice both equipment and facilities expenses (+3%) and manpower costs (+3%) have increased as a share of total operating costs while fees to ports authorities (concession fees) has decreased by 5% as a share of total operating expenses.

In many regions, port operators like ICTSI are subject to government-mandated salary adjustments, which I estimate to be 3-4 % per year over the last five years across all of ICTSI's ports. At a value level, manpower costs have increased by approximately 6%, driven by the addition of operations employees in ports in Brazil and Mexico, as well as the consolidation of Manila's North Harbour in 2022. Over the long term, both employee count and total manpower costs grow slower than revenue, resulting in margin expansion as ICTSI increases volume across its ports. I expect this trend to continue.
Equipment and facilities-related expenses are the fastest-growing segment within ICTSI's operating cost structure, which reflects the capital-intensive nature of ports. While not necessarily a clear reflection of ICTSI international ports, in MICT's company accounts for 2024, this segment is split into four further segments presented in the chart below - repairs and maintenance (37%), fuel, oil and lubricants (30%) and utilities (27%) are the majority of the costs within this segment.
The share of utilities is higher in more developed markets, such as Croatia and Poland, while fuel and oil prices correlate with crude oil prices. Between 2023 and 2024, the fuel, oil and lubricants division declined by 11%, reflecting the decrease in oil prices during that period. As ICTSI continues to invest in emission targets and increase its efficiency to support shipping companies, I expect repairs and maintenance to continue driving this segment over time and will match the revenue growth rate over the next few years.
Fees to port authorities can either be fixed fees (capitalised as part of concession rights), minimum guaranteed variable fees and other variable fees and here, the port authorities' share of gross' revenue only accounts for the final segment, which decreases over time and reflects why its share has reduced from 13.6% of total revenue in 2017 to 8.5% in 2024. Given that no significant concessions are due for renewal in the near term, this trend is expected to continue, albeit at a slower pace, for the foreseeable future.
Depreciation and capital expenditure
Depreciation and amortisation is split into three types;
Amortisation of concession rights ($139 million) is further split among upfront fees ($21 million), fixed fees ($35 million) and port infrastructure ($133 million).
Property and equipment depreciation ($102 million) is further split into six types, with leasehold rights and improvements ($35 million) and port facilities and equipment ($49 million) being the most significant contributors.
Right-of-use assets ($61 million)
Overall, these depreciation and amortisation charges are 11% of ICTSI's revenue, down from 16% in 2017. The decrease in revenue share is due to the fixed-cost nature of these depreciation charges on concession assets. These figures don't provide insights into ICTSI's core business, so it's essential to examine Capex and the port infrastructure segment of Capex in more detail.
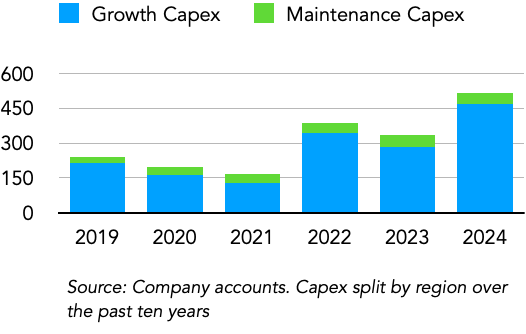
Port operators record the amortisation of intangible assets over the remaining years of their concession contracts with port authorities. As we approach the concession end dates, these charges decrease as a share of revenue, as evident in ICTSI's depreciation charges, which have declined from 15.8% in 2017 to 11% in 2024, a 6.2% CAGR during the period. An important metric is the relationship between depreciation and Capex. In the charts below, I explore Capex over the past ten years in relation to expected Capex from management guidance and depreciation.
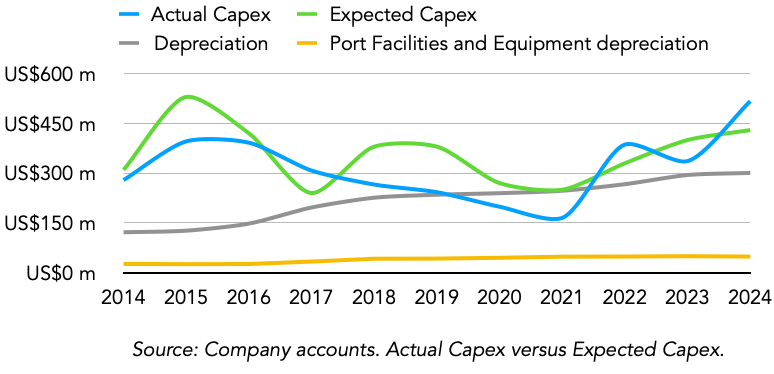
As the charts above illustrate, both Capex and expected Capex have generally trended above depreciation in most years, excluding the COVID-19 years, 2020 and 2021, when investments slowed across ICTSI and the broader industry, further suggesting that the majority of ICTSI's Capex is directed towards growth-oriented expenditures. ICTSI, on average, splits its Capex between maintenance (10%) and growth Capex (90%), and in its most recent years, its growth Capex has shifted towards expansionary projects.
For 2025, management has guided a Capex expense of $580 million. While I expect 2025 Capex to come in slightly ahead of this figure, it's essential to note that this represents the largest Capex management has ever recorded, reflecting the expansion opportunities across existing ports. Next, I will bring all the findings from its business model study to calculate its unit economics.
Unit economics
Port operators are very profitable businesses, and below, I explore ICTSI's unit economics based on importing one 20-foot container into Manila's port, including some assumptions that guide my unit economics calculations.
Revenue
20-foot container, palletised and full container load and non-use sustaining vessel.
Storage: Free for the first five days and $30 for each additional day of storage.
Other: I assume no penalty charges, extra gang services, personnel services or additional equipment rental services.
Costs
Roughly $11.6 per hour for each staff and approximately 3 hours of labour (12 people) across vessel-side (2 minutes), yard-side (3 minutes) and admin.
Fuel: 2.5 to 3 litres is required for the 1-yard move (380 metres) and one lift for RTG.
Depreciation: $42 million in annual depreciation and Capex charges, 3 million box moves, $14 per container move.
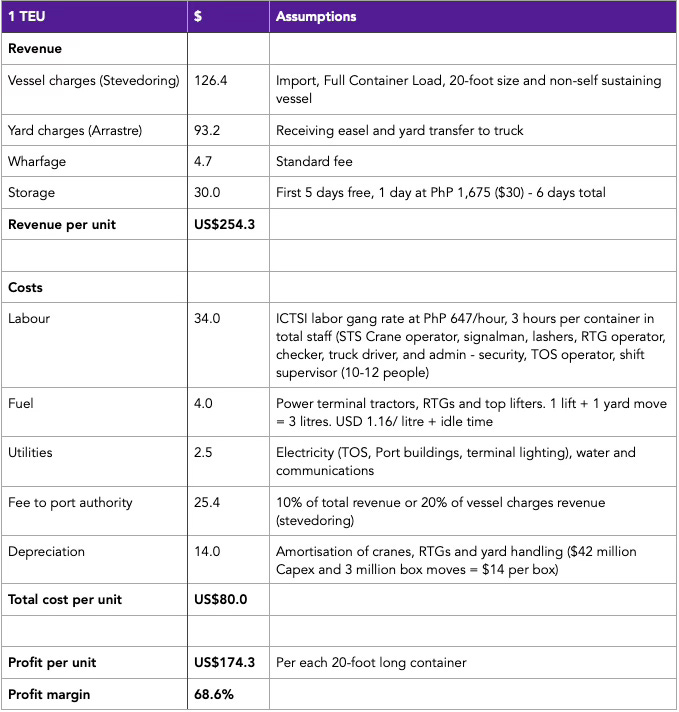
From my calculations in the table above, the revenue per unit is $ 254.30, while the total cost per unit is $80, resulting in a profit per unit of $174.30, or a profit margin of 68.6%, well above peers. This is marginally higher than ICTSI's revenue per TEU of $210 due to the range of containers and services offered. Importing costs more than exporting, and the presence of empty containers, which is estimated to be around 25-30% of container moves at Manila port, costs nearly 20% less than full containers.
ICTSI’s tighter cost control, particularly in labour and Capex, yields superior unit economics. This efficiency is a core pillar of the investment thesis.
5. ICTSI’s Growth opportunity
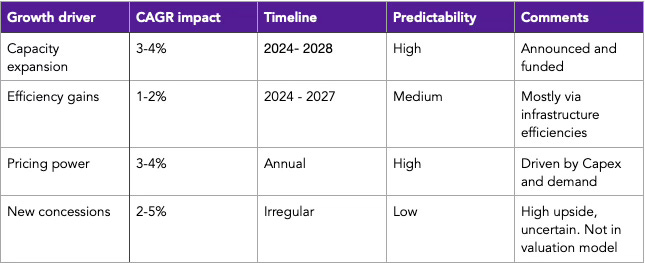
ICTSI is entering a new growth phase, driven by capacity expansions at its top-performing ports, additional efficiency push, strong pricing power, and opportunistic concession wins. These drivers could sustainably support at least 8–9% annual revenue growth over the next five years.
Existing capacity expansion
Improving efficiency (throughput/capacity)
Pricing power
Investments in new concessions
Existing capacity expansion
ICTSI has several ports with announced capacity expansions and will increase volumes, especially during peak periods. These investments are a good indicator of potential, and they are primarily focused on high-potential Tier 1 ports with longer concession end dates, providing an even greater return on investment. Some announced projects include;
Philippines (Manila): ICTSI has recently commenced construction of Berth 8 at MICT, Manila, which will add 200,000 TEUs and is designed for ultra-large container vessels with a capacity of up to 18,000 TEUs.
Philippines (Bauan, Batangas): ICTSI is investing $800 million to develop a 2 million TEU terminal in Southern Luzon, making it the second-largest facility in the country. Completion is expected in 2028, with the first operations in late 2027.
Australia: As the only fully automated container terminal in the Southern Hemisphere, ICTSI expects to install new hybrid automatic container carriers from Kalmar, increasing the port's capacity by 20% to 1.5 million TEUs annually.
Mexico: The Port of Manzanillo's CMSA recently added quay cranes as part of its current expansion plans to increase the port's capacity to 2 million TEUs annually, a 17.6% increase. A new berth is also expected to be completed later this year to support vessels with a 24,000-TEU capacity, and ICTSI has committed $300 million in investments between 2023 and 2026 to expand the port's operations.
Poland: ICTSI recently completed phase 1 of its reconstruction and upgrade projects at BCT, costing $42 million. Once Phase 2 is completed, it's expected to add 400,000 TEUs, a 33% increase.
Overall, there is at least a 15% increase in overall port capacity expansion already announced, which should be beneficial to its volume TEUs during our investment holding period and could result in at least a 3-4% growth in volume across ICTSI's ports.
Improving efficiency throughput/capacity
One growth approach within ICTSI's control is improving the efficiency at ports. The effects of these investments tend to skew towards newer, privatised ports or those where there have been underinvestments in previous years, often due to older equipment with wear and tear and significant downtime. These efficiency gains can be either through technological, operational or infrastructure investments.
Technological improvements
Although not the most obvious industry of application, technology plays a crucial role in enhancing efficiency and minimising downtime. ICTSI has consistently recognised the gains here, but since the pandemic, it's stepped up its efforts to improve operational efficiency across its terminals. In 2021, ICTSI began migrating various ports to a unified data platform powered by Microsoft Azure, as well as to the Navis N4 terminal operating system, to improve partner transactions and security. The impact of these technological improvements is primarily evident in the back end, where transactions between shipping lines and ports become faster, and also in enhancing visibility for tracking or booking deliveries, resulting in efficiency gains once they arrive and depart the port.
In its home ports in Manila, ICTSI employs a range of technologies to improve efficiency; however, not every investment necessarily has a significant impact. For example, the ICTSI app, launched a couple of years ago, was expected to be utilised by truck drivers, but years later, it continues to have a minimal impact on the overall booking and delivery system. On the brighter side, there have been notable innovations that have had a positive effect on customers, including the Terminal Appointment Booking System (TABS), which helps trucking companies schedule slots for container pick-ups and drop-offs and is said to have significantly reduced traffic congestion on city roads leading to the port.
Operational improvements
Building on TABS, it's clear that one of the most significant challenges for ports is congestion. It's estimated that a one-day increase in port dwell time can result in nearly 6 million TEUs of lost revenue globally for ports. To further address this challenge, several operational improvements can be employed at ports. A recent example, expected to yield significant gains in the near term, is the road improvements at the Port of Matadi in the Democratic Republic of the Congo, operated by ICTSI, which handles nearly 200,000 annual TEUs. ICTSI is currently constructing a 2.65 km road that will further link the port to the national highway network, which is expected to reduce dwell times and streamline cargo deliveries significantly. The first phase was completed in 2024, and the second phase commenced in February of this year.
Infrastructure improvements
As I discussed in the Capex section above, infrastructure improvements can lead to meaningful incremental gains and are the most significant of all three efficiency improvements, especially in recently privatised ports. These investments alone can lead to at least a 1% increase in volume per year over the next five years, and ICTSI has identified ports in Brazil, Mexico, Poland, and the Philippines as key areas of focus for future infrastructure improvements.
Pricing power
Pricing power is a critical and often overlooked growth driver for ICTSI. Over the past decade, it has raised average revenue per TEU from $130 to $210, a 3.9% CAGR through strategic tariff adjustments and investment-led renegotiations. Generally, a key driving force for pricing power is expected Capex; the more Capex and upgrades the port operators commit to, the more likely the port authority may approve new tariff adjustments. These pricing adjustments can sometimes be steep; in Manila, there was a 6% rise in several vessel and yard charges, following a significant increase in 2024.
Over the past ten years, ICTSI has grown its price per TEU from $130 to $210, a 3.9% increase per year, and it is estimated that most port operators in frontier and emerging markets ICTSI primarily operate in can raise prices by 4-5% per year over the long term and 6-7% for competitive and capacity constrained ports like Manzanillo port in Mexico.
Given the strong market position for most of ICTSI's ports and consistent demand for port terminals in markets it operates in, I see the potential for another decade of 3-4% pricing increase in USD terms over the years, mainly driven ports across its Asia and EMEA divisions and to a smaller extent, the ports in Brazil.
Investments in new concessions
Among the four growth drivers, investments in new concessions are the most difficult to predict and speculative, given that these deals are only publicly announced upon completion. That said, these new concessions are necessary for fueling growth at ICTSI, and while I can't predict exactly where these port concessions may come from, it's one we certainly shouldn't ignore. An ongoing case is with the Port of Durban Pier 2, estimated to have a 2 million TEUs capacity with the potential to increase to 2.8 million TEUs.
Beyond the ongoing case, there is an increasing interest among governments and port authorities in privatising ports, with several case study success stories. Building on its investments in Madagascar, ICTSI recently flagged other frontier countries in Africa, including Djibouti, as potential destinations for future concessions. These potential concession announcements are something I expect to track closely, and I estimate that at least 2% of volume growth over the next five years will be attributed to unannounced concession agreements - I don't include these in the valuation model.
Historically, ICTSI has added one new concession roughly every two years. While unpredictable, these wins tend to be margin-accretive and strategically located in underserved markets. Over a five-year holding period, 2–3 new ports could conservatively add 5–8% to TEU capacity, an upside not currently reflected in my base valuation model.
6. Jenga IP Quality assessment
The Jenga IP Quality Index is a structured framework for assessing a business's competitive strength and durability, which are key factors underpinning valuation and multiple expansion potential. I've previously analysed Alphabet (score - 82), the parent company of Google, as well as the Mexican airports OMA (78) and ASUR (74) in previous deep dives. As a reminder:
High moats >75
Emerging moats 70-75
Weak moats 65-70
No moats <65
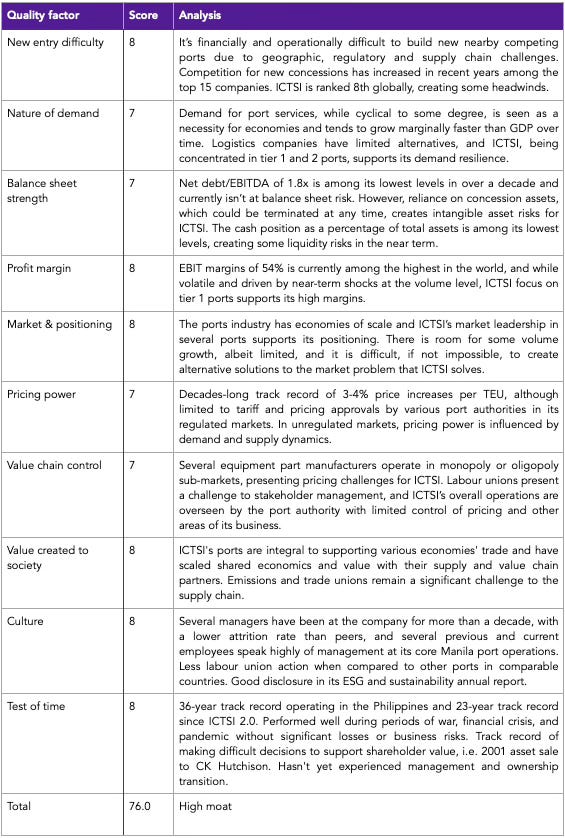
ICTSI's 76/100 score reflects a combination of pricing power, economic resilience, and operational scale in emerging markets, supporting its premium to the EM average multiple. I will explore two areas I haven't discussed yet: balance sheet strength (7/10) and test of time (8/10).
Balance sheet strength (7/10)
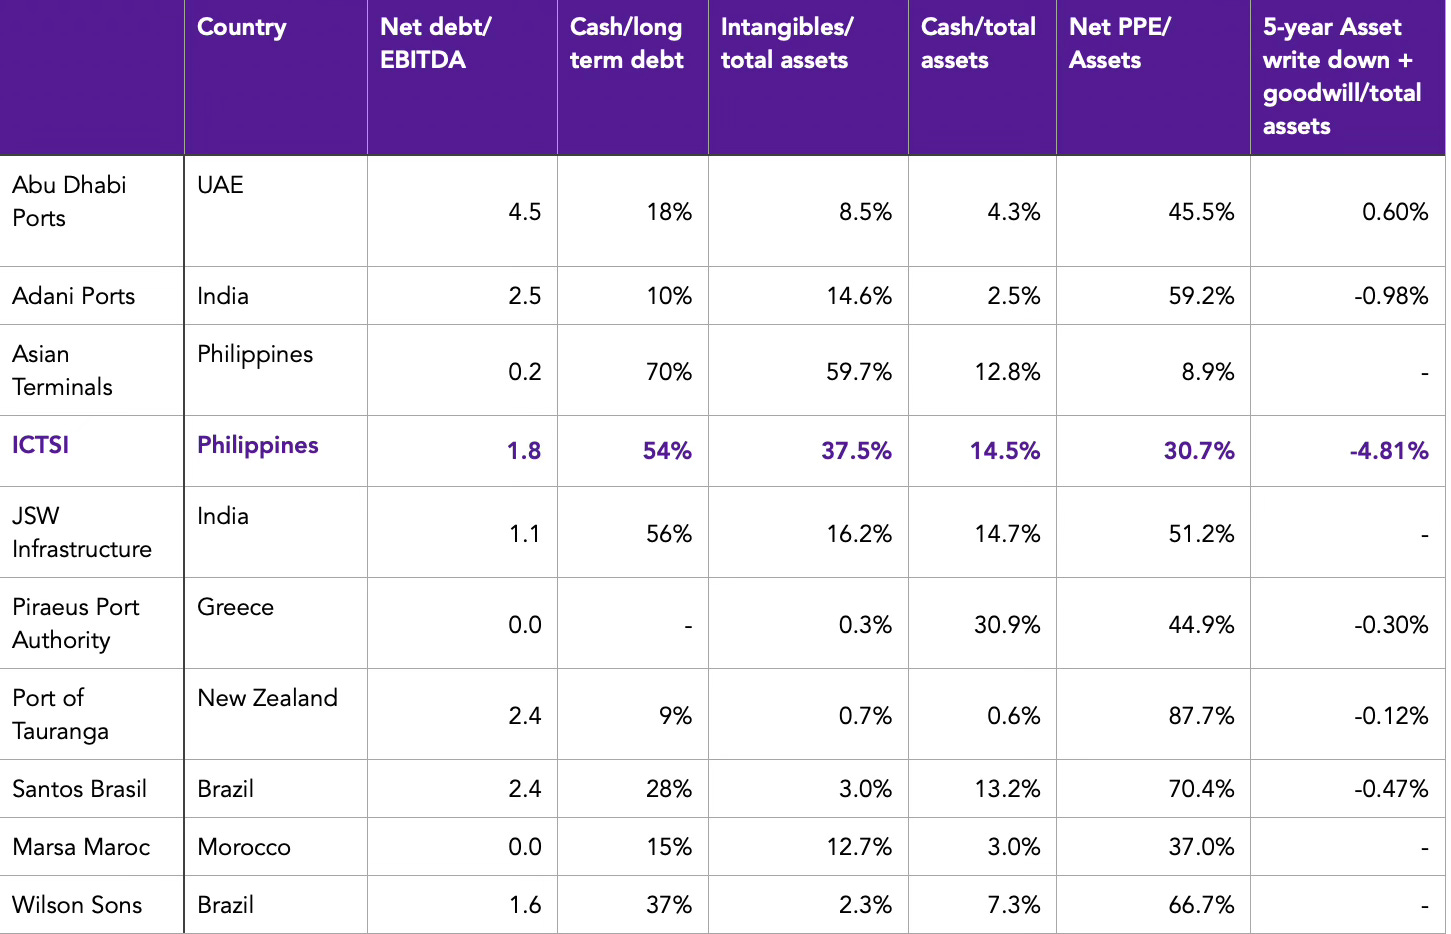
ICTSI's reliance on concession rights means that intangible assets comprise a significant portion of its balance sheet, creating vulnerability if contracts are revoked or challenged. Over the past 5 years, ICTSI has booked $368 million in asset writedowns (~4.8% of total assets), significantly above peers. While its 1.8x net debt/EBITDA is reasonable, ICTSI remains more leveraged than competitors like Marsa Maroc or Asian Terminals, potentially constraining its ability to compete aggressively in future concession bids.
In the table below, I provide a closer look at ICTSI's long-term debt, highlighting the entities, maturity year, and value of each loan.

ICTSI attempts to match its currency exposure where possible. For its Australian port, ICTSI secured a $246 million loan at a fixed interest rate of 4.27% to support its operations at the Port of Melbourne.
Test of time
A key quality metric in the Jenga IP Quality index is the test of time. How well companies have performed in the face of external shocks such as financial crises, wars, pandemics, internal management changes or political upheavals. Since its creation 37 years ago, ICTSI has faced numerous challenges, including country-specific challenges in Syria, Brunei, and Iraq.
Its experience over the years is one of the key drivers behind its more disciplined capital allocation framework compared to previous years, as well as its decision to diversify across several countries, thereby limiting the risk posed by any single country or region. To see this in action, let's review how it coped compared to peers during the 2000s financial crisis.
Case study - ICTSI (the 2007 - 2010 financial crisis)
Key operational stats in 2009
Yield: Revenue per TEU fell -2% in 2009
ICTSI Volume: Total volume fell by -4.8% during the year
Global trade volume: Declined by -8.5% during the year
Between 2008 and 2010, several companies were affected by the financial crisis, and the transport infrastructure industry wasn't immune to these challenges. Globally, trade volumes in TEUs fell by -8.5%, and several high-quality industrial companies experienced EBIT declines, such as Caterpillar (-71%), Schneider Electric (-31%), Boeing (-50%) and Union Pacific (-17%), with global GDP falling by 1.33%. ICTSI wasn't immune to the financial crisis, as its EBIT declined by 19%, which is less than several of its industrial peers.
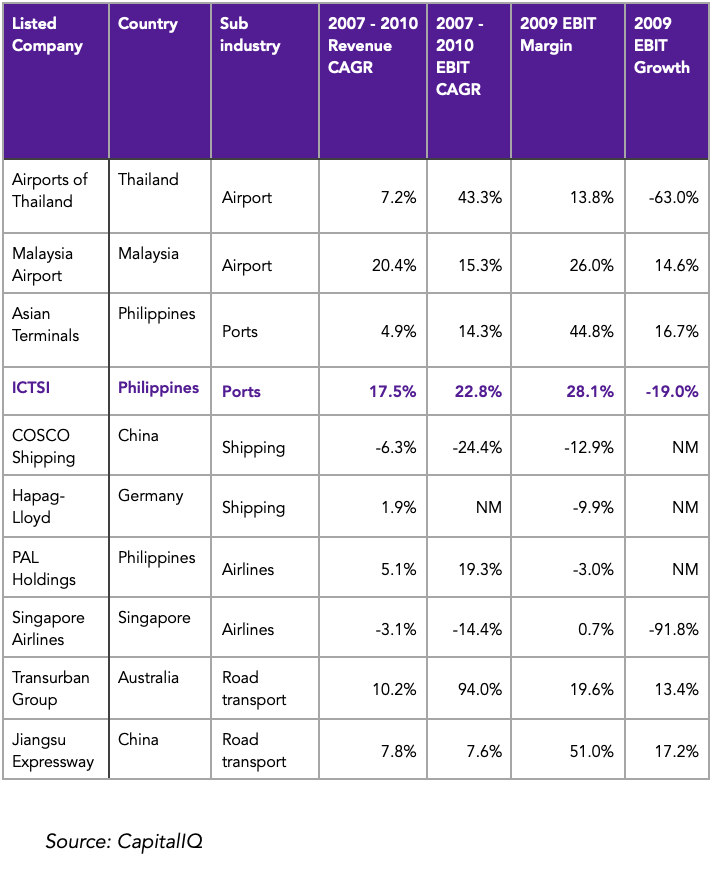
In the table above, I compare ICTSI's performance relative to its peers in the airline, airport, port, shipping, and toll gate industries to provide some perspective on its business resilience and its ability to weather the test of time. ICTSI not only remained profitable during the worst economic decline in a generation, it also outperformed its peers across ports, airports, and heavy industry while maintaining a respectable EBIT margin. This resilience underscores its operational leverage, pricing flexibility, and capital discipline.
Between 2007 and 2009, ICTSI shares returned 15% with dividends included, compared to the S&P 500's return of -21% and the MSCI EM Index's return of 6.9% during the same period. Note that ICTSI shareholders experienced a 50% drawdown over the three years preceding their recovery in Q4 2009.
While this doesn't guarantee that ICTSI will outperform the broader market during challenging periods, I take some comfort in its track record, which proves its business model can weather the worst of economic storms, unlike its industrial peers in the airline and shipping industries.
Other challenges and risks
There are a few other challenges and risks worth highlighting, and while I'm only briefly mentioning these in the report, they are critical to the overall investment case, and I'll briefly work you through how I've accounted for these:
Political risks: The Philippines has a history of political instability over the past few decades. While we are currently experiencing more peaceful times socially and economically, it's worth considering these factors in terms of growth potential and quality of the investment case. The worst-case scenario is the government nationalising its ports without compensating ICTSI for the loss of revenue. This situation is highly unlikely, except in the event of a complete political upheaval.
Beyond the Philippines, ICTSI operates in several other politically unstable countries, including the Democratic Republic of the Congo, Georgia, Iraq, and Cameroon. Admittedly, these countries are too risky for us as single investments, but I take some comfort in ICTSI's diversified strategy across various frontier and emerging markets, with its largest ports being tilted towards countries with more stable governments, such as Brazil, Australia, and Mexico. In my valuation model, I've accounted for these political challenges by adding two significant asset writedowns due to potential concessions in these high-risk countries.
Currency risks: An extension of the underlying economic and political risks present in several of ICTSI's countries of operation is currency volatility, which poses associated risks to revenues and costs. On average, the majority of these countries currency depreciate 3-15% per year against the US dollar, which poses challenges for ICTSI. One of the positive strengths of ports is that the shipping industry prefers to operate in US dollars.
Fees, such as vessel charges, may be denominated in local currencies but are actually priced in US dollars, providing a further natural hedge to ICTSI's international operations. For the Philippines, I have modelled its currency to depreciate against the US dollar by 2% per year and have accounted for this in our valuation calculation. Note that the valuation model is denominated in US dollar terms.
Trade and tariffs: Trade is at the heart of ICTSI's business model; however, a global shift toward self-sufficiency poses a significant long-term risk to the company. While the idea of every country pursuing self-reliance may seem philosophical, recent trends toward protectionism in several developed markets have already slowed the growth of trade as a percentage of GDP. This, in turn, has led to weaker growth across many major ports. If similar protectionist policies were to spread across the emerging markets where ICTSI operates, the impact on the company's profitability and future growth could be substantial.
Lower trade volumes would mean less demand for ICTSI's port services, while fixed infrastructure costs would remain, putting pressure on margins. Additionally, increased tariffs and trade barriers could further dampen shipping activity and reduce the flow of goods through ICTSI's terminals. Although ICTSI benefits from a diversified global portfolio and a strong presence in fast-growing regions, its core business remains closely tied to the health of international trade. As such, the risk of rising protectionism and a move toward self-sufficiency is one I will continue to monitor closely, as it could have meaningful implications for ICTSI's long-term prospects.
Overall, ICTSI scores 76/100 on the Jenga IP Index - a high-moat operator with no sub-7 scores, a proven record of resilience, with high barriers to entry. While political and currency risks are real, I factor these into the company's valuation, and they are offset by ICTSI's geographical footprint, disciplined expansion, and consistent margin strength. The final segment of the investment equation I haven't yet addressed is valuation. Next, I will work you through my model and thought process for valuing ICTSI.
7. Valuation
You can view my detailed spreadsheet model here.
To answer the critical question of what should we pay for ICTSI’s shares, there are four questions worth asking:
Relative to the Philippines index: Does ICTSI deserve a multiple above its domestic peers, which is currently valued at 11.8x (median P/E of 9x) and a market I estimate should be valued at 13x?
Relative to the global average index: The MSCI ACWI index is currently valued at 21.3x trailing (18.1x forward) earnings. I value the average listed company at 15x earnings, and a key question is, does ICTSI deserve a multiple above the average of globally listed companies?
Relative to the comparable port operators: I list nine other port operators in the table below and highlight key fundamental metrics. On average, these companies are valued at an average trailing P/E of 16x or 14x EV/EBIT. Does ICTSI deserve a multiple above the average listed comparable port operator?
Earnings growth: Based on my analysis of its volume, pricing, and cost structure prospects, what earnings and cash flow growth can we reasonably expect with a margin of safety over the next five years?
Relative to the Philippines Index
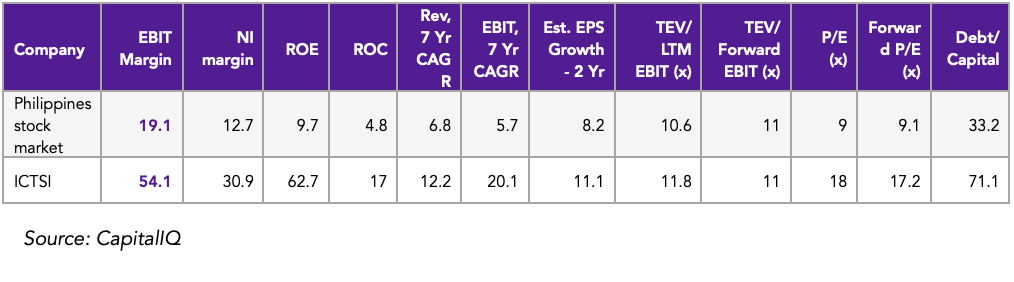
There are 155 listed Philippine companies with a market capitalisation above $50 million, with ICTSI being the second-largest. To answer this question, I compare ICTSI with the average (median) listed Philippine company that has a market capitalisation above $50 million, using the table below. From the table, it's clear that ICTSI is far superior in quality and growth metrics.
It has an EBIT margin and profit after-tax margin more than double that of the average Philippine company. Similarly, ICTSI is far superior in terms of return on equity (63% versus 12.7%) and has grown its earnings faster over the past five years, with expectations of faster growth than the market over the next two years, according to sell-side estimates. However, ICTSI is valued at twice the multiple of the average Philippines company. While I don't think ICTSI is twice as good as every Philippines company, an earnings multiples premium relative to the market is well justified.
2. Relative to the global average
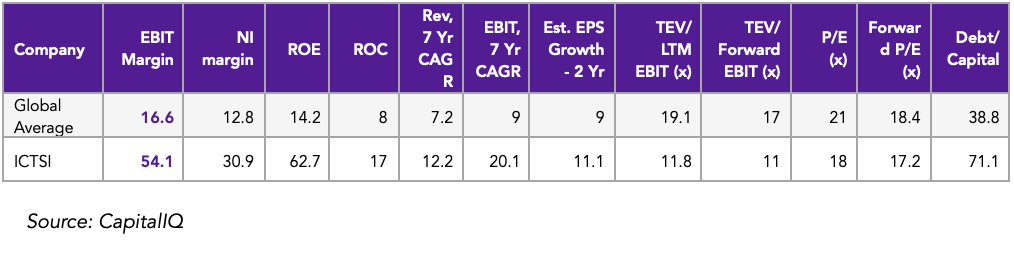
There are 1,337 globally listed large cap companies with a market cap above $15 billion, and in the table below, I similarly compare ICTSI to the average listed large cap (median average). Again, ICTSI performs better in all but one quality metric, debt-to-capital, and is also expected to grow earnings slightly faster than the average listed company. Overall, while the global average multiple is somewhat elevated, ICTSI's quality is superior to that of the average listed large-cap company, justifying an earnings multiple of more than 15x.
3. Relative to listed port operators
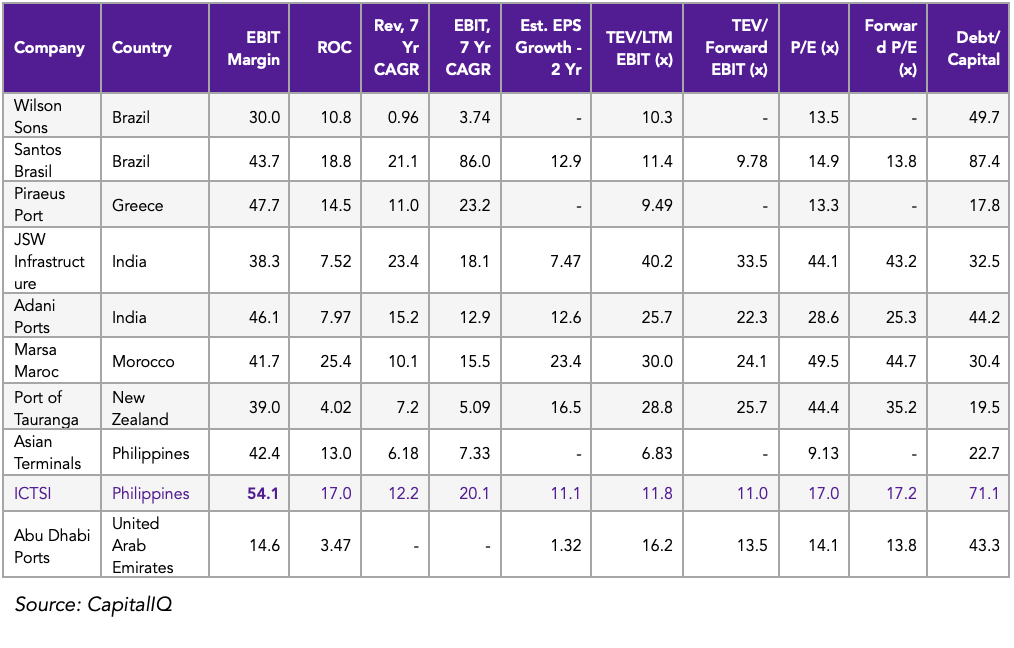
To compare ICTSI to its industry peers, I selected nine other high or emerging moat port operators and compared ICTSI on key metrics. From a multiples lens, the average company is currently valued at 16x P/E, compared to ICTSI's 17x P/E. However, from a quality lens, ICTSI performs much better than several peers in the Jenga IP Quality Index. One company comparable to ICTSI's quality is Marsa Maroc, which is listed on the Moroccan stock exchange. You can read my brief thoughts on them here. Compared to ICTSI, Marsa Maroc is valued at 50 times, and while this is well above its intrinsic valuation, it illustrates how richly valued quality ports can become.
At the other end of the valuation spectrum is Asian Terminals, ICTSI's closest rival in Manila, which is valued at 9x earnings, a multiple I deem too low. Admittedly, Asian Terminals is actually more undervalued than ICTSI (we see an 18% IRR on its stock), but my preference for higher-quality businesses leans towards ICTSI.
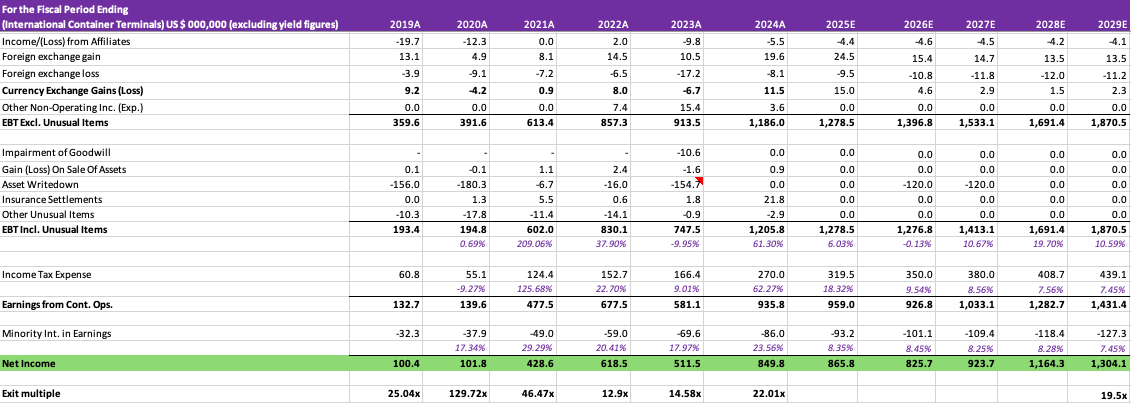
Based on where I view ICTSI's business quality and growth estimates and performance relative to peers and the broader market, I believe a 2029 earnings exit multiple of 19.5x is appropriate (2029 estimated free cash flow yield of 35.2%)
From an earnings growth lens, I estimate ICTSI's net profits to grow at an 8.9% 5-year CAGR. Including the net effects of dividends and share buybacks over the past five years, I estimate a potential total shareholder return of 89.5% over the next four and a half years, or a 15.3% internal rate of return (IRR) over this period.
Revenue assumptions
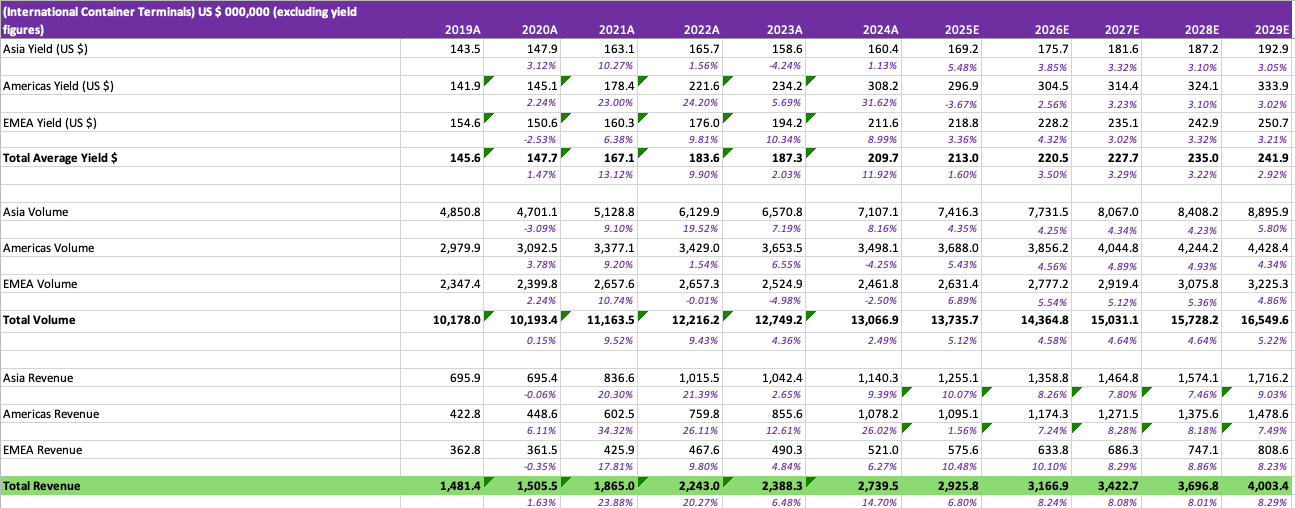
Yield: Note that the actual yield will be lower than our figures due to the inclusion of non-containerised volumes in my calculations. For example, the 2024 yield was $204 versus my calculated $209.70. I also expect the America's region yield growth to report the slowest growth due to 2024 price increases but still end 2029 well above Asia and EMEA's revenue per TEU.
Volume: Overall volume is expected to grow by 4.8% CAGR, led by EMEA (5.6% CAGR). I assume the newly built Luzon port will commence full operations at the end of 2028, leading to faster Asia volume growth in 2029. Additional investments in Manila, Poland and Australia will increase volume growth from a capacity lens.
While I expect ICTSI to announce new concessions during the five years, I haven't included this in my revenue forecast. Any new concessions are likely within the EMEA division.
Overall, revenue is expected to grow at a rate of 7.9% per year over the next five years, resulting in $4 billion in revenue for the group by 2029.
Costs assumptions
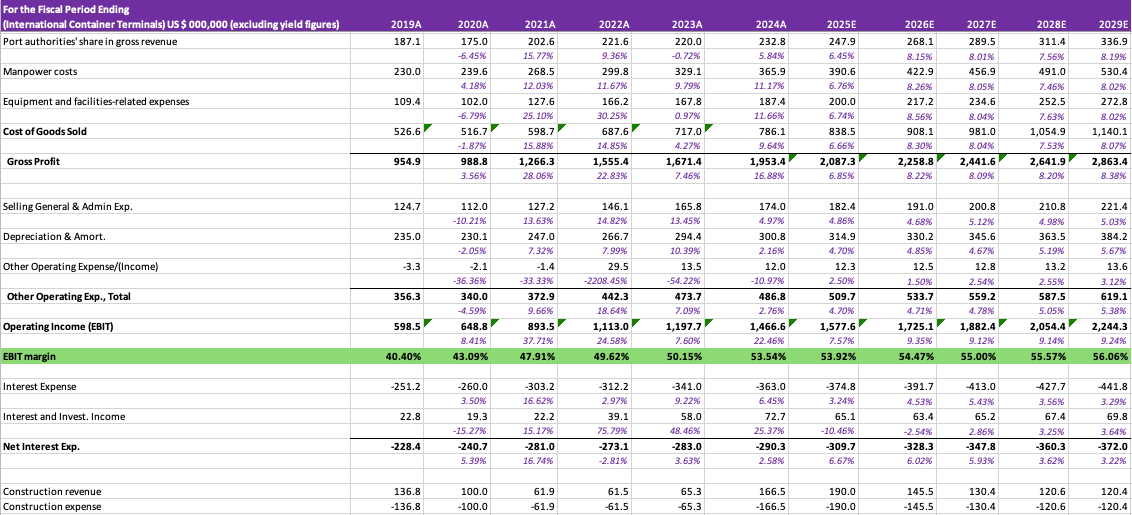
Manpower costs: Increased automation and modernisation will likely lead to lower growth in labour costs as fewer people are needed to operate cranes and other key areas of ports.
Equipment and facilities expenses: With significant Capex planned for the coming years, equipment expenses are the fastest-growing, with a marginally higher contribution from repairs and maintenance.
Administrative expenses: ICTSI should maintain its corporate discipline, with limited growth in general and administrative expenses, leading to some margin expansion in EBIT.
Asset writedown: Given the volatility in some countries where ICTSI operates, I assume two hefty asset writedowns of $120 million each in 2026 and 2027 as a margin of safety.
Capital expenditure: ICTSI guides a Capex of $580 million to support projects in Manila, Brazil, Australia, and Batangas. On average, approximately 10% of the total Capex is allocated towards maintenance projects, while the remainder is divided between expansionary or new projects.
Shareholder returns
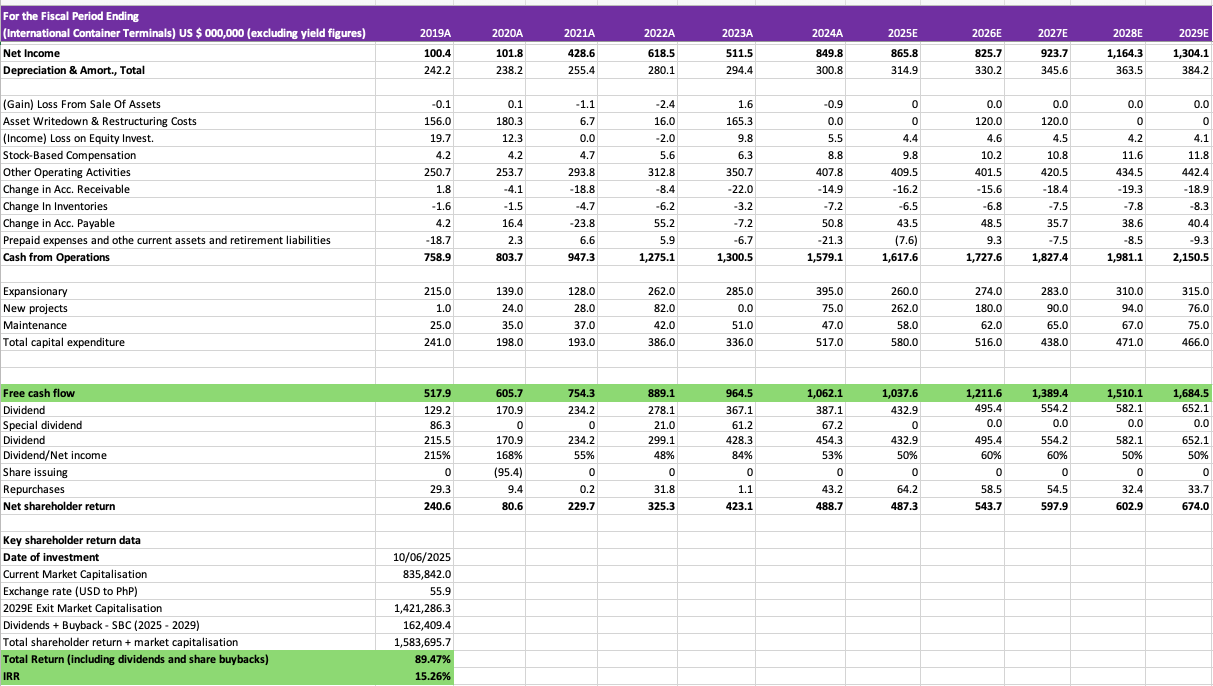
Dividends: Although ICTSI's dividend policy isn't precisely clear or fixed, I estimate between 50-60% of net income will be paid out as dividends between 2025 and 2029.
Exit multiple: Based on my analysis of quality (high moat) and earnings growth (9% CAGR between 2024 and 2029), a 19.5x exit multiple by 2029 is appropriate for ICTSI.
IRR: I expect a total shareholder return of 89.47% over the next four and a half years or 15.26% IRR.
Conclusion and portfolio management thoughts
ICTSI presents a mix of high-quality operations, disciplined capital allocation, and credible long-term upside, making it a strong candidate for a long-term investment in a global equity portfolio.
This is my first direct investment consideration in both the Philippines and the broader Southeast Asian region, as well as in the port infrastructure sector. Both region and the industry are areas I intend to spend significantly more time to researching in the years ahead. Outside of ICTSI, I've flagged Asian Terminals, its smaller peer in Manila, as a potential follow-on investment. At 9x earnings, 0.2x net debt/EBITDA, and a 6.4% dividend yield, it offers solid fundamentals with projected earnings growth of at least 6%. I also recently explored the investment case for LT Group, listed in the Philippines, but concluded that at the moment, its political risks are above my level of comfort.
From a risk management perspective, any exposure to the Philippines will be capped at 10% of the portfolio at initiation. I plan to raise ICTSI's weighting to 5–6%, and, more broadly, I'm comfortable increasing our allocation to transport infrastructure to up to 20% of the Fund, provided we continue to find similar high moat, reasonably valued businesses with long-term growth potential.
Should ICTSI's share price fall to PHP 337 per share (-18.7% decline from today's price), I'm likely to raise its weighting to the maximum of 7.5% as long there are no clear fundamental issues. At this price, I see a potential IRR of 20%, my hurdle for a 7.5% position.
Given ICTSI's geographic footprint and the markets' perception of frontier and emerging market risk, I certainly expect volatility in its share price. For that reason, I will prioritise ICTSI in deploying cash during broader market drawdowns, where price dislocation is more likely than a fundamental shift in quality.
I'll look deeper into them and get back to you on this.
Hello Dede, Do you know if it is possible to buy stocks of ICT with IBKR? Unless I'm mistaken I can't see any option to buy stocks trading in the PSE neither to buy the OTCs.